Revenue Intelligence ROI Calculation: How to Justify the RI Investment to CFO?
Written by
Ishan Chhabra
Last Updated :
December 24, 2025
Skim in :
7
mins
In this article
Revenue teams love Oliv
Here’s why:
All your deal data unified (from 30+ tools and tabs).
Insights are delivered to you directly, no digging.
AI agents automate tasks for you.
Thank you! Your submission has been received!
Oops! Something went wrong while submitting the form.
Meet Oliv’s AI Agents
Hi! I’m, Deal Driver
I track deals, flag risks, send weekly pipeline updates and give sales managers full visibility into deal progress
Hi! I’m, CRM Manager
I maintain CRM hygiene by updating core, custom and qualification fields all without your team lifting a finger
Hi! I’m, Forecaster
I build accurate forecasts based on real deal movement and tell you which deals to pull in to hit your number
Hi! I’m, Coach
I believe performance fuels revenue. I spot skill gaps, score calls and build coaching plans to help every rep level up
Hi! I’m, Prospector
I dig into target accounts to surface the right contacts, tailor and time outreach so you always strike when it counts
Hi! I’m, Pipeline tracker
I call reps to get deal updates, and deliver a real-time, CRM-synced roll-up view of deal progress
Hi! I’m, Analyst
I answer complex pipeline questions, uncover deal patterns, and build reports that guide strategic decisions
TL;DR
Key Takeaways:
ROI Framework: Revenue intelligence delivers 481% ROI over 3 years with $10M NPV, driven by 35% win rate improvements, 25% forecast accuracy gains, and 2-3 hours/week time savings per rep.
Total Cost Reality: Mid-market teams (250 users) face $1.6M-$2M TCO over 3 years for Gong+Clari stacks when including hidden costs like RevOps FTE, training, and integration fees.
Payback by Segment: SMBs achieve 6-9 month payback with 70%+ adoption; mid-market teams hit 9-12 months at 75% utilization; enterprises require 12-18 months due to complex implementations.
Risk-Adjusted Scenarios: Best case (90%+ adoption, 6-9 month payback), base case (75% adoption, 9-12 months), conservative case (50% adoption, 15-18 months) with probability weighting for CFO approval.
Agentic ROI Advantage: AI-native platforms like Oliv.ai achieve 40-50% faster payback through instant deployment (2-7 days vs 24 weeks), autonomous CRM updates, and modular agent pricing.
Intangible Benefits: Sales-CS handoff improvements reduce onboarding friction 40-60%, talent retention savings ($75K-$150K per replaced AE), and 95%+ CRM data quality enabling downstream automation.
Q1: What is Revenue Intelligence ROI and Why Does It Matter in 2025? [toc=ROI Definition & 2025 Context]
Revenue Intelligence ROI measures the measurable return from platforms that capture, analyze, and act on customer-facing interactions across your sales organization. In 2025, this calculation has fundamentally shifted. Call recording and transcription (once premium features) are now commoditized offerings from Zoom, Microsoft Teams, and Google Meet, available free or at minimal cost. The modern ROI equation must focus on agentic automation and actionable intelligence, not just meeting documentation.
⚠️ The Legacy Problem: Dashboards That Require Digging
Traditional revenue intelligence tools like Gong and Clari built their foundations a decade ago on a fundamentally flawed premise: that sales teams need more data to analyze. These platforms provide extensive dashboards, keyword trackers, and analytics modules, but they still require managers to "dig through ten screens" to find insights and reps to manually update CRM fields after every call.
"While Gong offers valuable insights into call data and sales interactions, our experience has been impacted by significant data access limitations... it requires downloading calls individually, which is impractical and inefficient for a large volume of data." Neel P., Sales Operations Manager, G2 Verified Review
❌ The Manual Labor Burden
This approach places the burden squarely on humans. Managers spend late nights reviewing call recordings. Reps lose 2-3 hours weekly on CRM data entry. RevOps teams manually consolidate forecasting spreadsheets in weekly "roll-up" sessions. The industry has reached what analysts call the "trough of disillusionment" with first-generation AI that fails to integrate deeply into workflows.
Modern revenue intelligence has evolved through four distinct generations: Revenue Operations to Revenue Intelligence to Revenue Orchestration to AI-Native Revenue Orchestration. The latest paradigm calculates ROI based on agentic automation (where AI performs the actual work rather than simply surfacing data for humans to act upon). Instead of providing a list of missing MEDDPICC fields, AI agents automatically populate them. Instead of flagging a stalled deal, AI agents proactively draft the next action plan.
💰 Oliv.ai's Agentic Foundation: Intelligence That Works for You
We've built Oliv.ai as a generative AI-native platform where autonomous agents execute tasks across your revenue operations. Our CRM Manager agent automatically updates critical fields (Economic Buyer, Champion, MEDDPICC criteria) directly in your CRM, eliminating manual data entry entirely. The Forecaster agent performs bottom-up forecasting autonomously by inspecting every deal in your pipeline, replacing the manual "roll-up" process that Clari still requires.
Unlike Gong's decade-old keyword trackers, Oliv.ai leverages fine-tuned large language models that understand deal context, not just meeting-level keywords. Our Deal Driver agent delivers proactive alerts via Slack or email ("right on time" intelligence, not noisy dashboards). Managers receive Sunset Summaries; reps get Morning Briefs. No late-night call reviews required.
⭐ The Measurable Difference
Teams using unified AI tools see 25% higher forecast accuracy and 35% higher win rates when leveraging AI functionality like contextual deal alerts and automated trackers. This isn't about having better dashboards (it's about having AI that does the work while your team focuses on selling).
Q2: How Do You Calculate Revenue Intelligence ROI? (Total Economic Impact Framework) [toc=ROI Calculation Framework]
Calculating revenue intelligence ROI requires moving beyond simple subscription cost comparisons to a comprehensive Total Economic Impact (TEI) framework. This methodology, adapted from Forrester's established approach, captures four distinct value pillars: direct revenue impact, efficiency gains, risk mitigation value, and strategic flexibility.
Total Economic Impact (TEI) framework for revenue intelligence ROI calculation featuring four interconnected pillars: direct revenue impact, efficiency gains, risk mitigation value, and strategic flexibility with quantifiable metrics per category.
💸 The Core ROI Formula
Start with the standard ROI calculation:
ROI = [(Total Benefits - Total Costs) / Total Costs] × 100
However, revenue intelligence ROI demands a more nuanced approach. You must also calculate Sales Velocity, the speed at which deals move through your pipeline:
Sales Velocity = (Number of Opportunities × Average Deal Size × Win Rate) / Sales Cycle Length
Revenue intelligence platforms impact all four variables: they increase opportunity volume through better pipeline management, preserve deal sizes through champion identification, improve win rates through coaching insights, and compress sales cycles through proactive deal alerts.
✅ The Four-Pillar Total Economic Impact Framework
1. Direct Revenue Impact Quantify top-line growth drivers:
Win rate improvements: Industry benchmarks show 20-35% increases with AI-powered deal intelligence
Deal acceleration: Average 7% improvement in deal velocity
Forecast accuracy: Teams achieve 90%+ accuracy vs. 65-75% industry baseline
Pipeline expansion: Reduced leakage and slippage preservation
2. Efficiency Gains Measure time and cost savings:
Rep productivity: Save 2-3 hours per week on CRM data entry
Manager productivity: Reclaim 1 day per week from manual call reviews
The TEI framework provides a defensible, comprehensive business case that addresses CFO concerns about both quantifiable returns and strategic value creation.
Q3: What Are the Hard Costs vs. Hidden Costs of Revenue Intelligence Platforms? [toc=TCO Breakdown]
Understanding the Total Cost of Ownership (TCO) for revenue intelligence platforms requires examining both obvious subscription fees and hidden operational expenses that often double or triple the initial budget projection.
💰 Hard Costs: The Visible Expenses
Platform Licensing Fees Premium revenue intelligence platforms charge in three layers:
Base platform fees: $5,000-$50,000 annually (mandatory regardless of user count)
Per-user licenses: $1,600-$2,400 per user annually ($133-$200/month)
A 250-user deployment of Gong, for example, typically costs $1.6M over three years when bundling conversational intelligence, forecasting, and engagement modules.
Implementation & Onboarding Year 1 implementation fees vary dramatically by vendor:
Small business packages: $7,500-$15,000 (basic setup, 2-5 users)
Enterprise deployments: $50,000-$150,000+ (multi-CRM, global rollout, 100+ users)
Traditional platforms like Gong require 8-24 weeks for full deployment, while legacy tools like Clari need 12-16 weeks for proper forecast configuration.
⚠️ Training & Enablement Costs
Budget for structured training programs:
Initial training: $5,000-$20,000 for team-wide onboarding
Ongoing enablement: $10,000-$30,000 annually for new hire ramps and feature adoption
Admin certification: $2,000-$5,000 per RevOps administrator
"It was a big mistake on our part to commit to a two year term. Gong is a really powerful tool but it's probably the highest end option on the market... all have said the same thing – they've been fine using a lower cost, simpler alternative." Iris P., Head of Marketing, Sales & Partnerships, G2 Verified Review
⚠️ Hidden Costs: The Budget Killers
RevOps Personnel Requirements Revenue intelligence platforms don't run themselves:
Platform administrator: 0.5-1.5 FTE dedicated to managing integrations, user permissions, and data flows ($40,000-$120,000 annually)
Configuration specialists: Ongoing tracker creation, custom field mapping, workflow optimization
Change management: Driving adoption, responding to user questions, updating playbooks
CRM Integration Complexity Beyond standard Salesforce/HubSpot connections:
Custom field mapping: $2,000-$5,000 for fields beyond standard limits
Multi-object integration: $5,000-$15,000 for opportunity, account, and contact-level syncing
Bi-directional sync maintenance: Ongoing debugging when CRM updates break integrations
API rate limit management: Additional Salesforce API licenses ($3,000-$10,000 annually)
💸 Data Migration & Price Escalation
Data Migration & Historical Import Switching platforms creates one-time costs:
Call recording migration: $5,000-$30,000 to import 6-12 months of historical calls
Transcript reprocessing: $0.10-$0.50 per minute of audio (can reach $50,000+ for large libraries)
Metadata mapping: Manual effort to tag speakers, opportunities, and custom fields in legacy data
Auto-Renewal Uplifts & Price Escalations Read the fine print:
Annual increases: 5-15% automatic price increases at renewal (often hidden in Section 12 of contracts)
User minimum commitments: Some vendors require 80%+ of original license count even if headcount decreases
Feature gates: Functionality promised during sales cycle later moved to higher tiers
📊 Hidden Cost Summary Table
Hidden Cost Breakdown by Year
Hidden Cost Category
Year 1
Years 2-3 (Annual)
RevOps Personnel (1 FTE)
$80,000
$85,000
Custom Integrations
$10,000
$5,000
Data Migration
$25,000
$0
Training & Enablement
$15,000
$20,000
Auto-Renewal Uplift
$0
$16,000-$48,000
Total Hidden Costs
$130,000
$126,000-$158,000
"We've had a disappointing experience... The tool is slow, buggy, and creates an excessive administrative burden on the user side." Anonymous Reviewer, G2 Verified Review
How Oliv.ai Simplifies Total Cost of Ownership Oliv.ai addresses TCO concerns through instant deployment (5 minutes to 2 days vs. 24 weeks), modular pricing (pay only for agents you use), and autonomous operation (minimal RevOps overhead required). Our free tier replaces Gong's recording layer entirely, while our agentic architecture eliminates the manual configuration burden that drives hidden costs skyward.
Q4: What Revenue Impact Can You Expect? (Win Rate, Deal Velocity, Forecast Accuracy) [toc=Expected Revenue Impact]
Revenue intelligence ROI hinges on three quantifiable top-line drivers that CFOs prioritize in business case approvals: win rate improvement, deal velocity acceleration, and forecast accuracy enhancement. These metrics directly translate to quota attainment, predictable revenue, and board-level confidence in pipeline health.
❌ The Passive Analytics Problem
Traditional revenue intelligence platforms like Gong and Clari take a fundamentally reactive approach. They record calls, generate keyword trackers, and populate dashboards (then wait for managers to interpret the data, identify coaching opportunities, and manually intervene with reps). This creates a multi-step delay between insight discovery and action execution.
"The additional products like forecast or engage come at an additional cost. Would be great to see these tools rolled into the core offering." Scott T., Director of Sales, G2 Verified Review
Many organizations pay for comprehensive Gong suites (conversational intelligence + forecasting + engagement) but ultimately use only the call recording layer. Managers spend hours reviewing dashboards to find actionable insights, while reps continue missing critical deal signals because alerts arrive too late or get buried in notification noise.
✅ Proactive Deal-Level Intelligence
The AI-era paradigm delivers contextual intelligence right on time (not meeting-level summaries, but deal-specific alerts delivered via Slack or email when action is required). Instead of managers "digging through ten screens" to find stalled deals, AI surfaces them proactively: "Champion hasn't engaged in 14 days on the $250K opportunity," or "Economic buyer mentioned budget concerns (draft follow-up recommended)."
This real-time intervention capability enables immediate rep course-correction. When a competitor gets mentioned on a call, the alert arrives within minutes with suggested positioning. When MEDDPICC criteria remain incomplete three weeks before close date, the system flags it automatically.
💰 Oliv.ai's Revenue Acceleration Engine
Our Deal Driver agent analyzes every opportunity in your pipeline continuously, flagging early-stage deals "showing the right signals" and preventing late-stage slippage. Unlike Gong's manual tracker configuration, Deal Driver understands deal context through fine-tuned LLMs (not just keyword matching).
Key differentiators:
Sunset Summaries for managers: End-of-day digest highlighting deals requiring attention (no late-night call reviews)
Morning Briefs for reps: Prioritized action list based on deal health scores
Industry benchmarks demonstrate the revenue impact potential:
Revenue Impact Benchmarks by Metric
Metric
Industry Baseline
AI-Powered Improvement
Revenue Impact Example
Win Rate
15-20%
+35% with AI trackers
20% to 27% = 35% more wins
Deal Velocity
60-90 days
+7% acceleration
75 days to 70 days
Forecast Accuracy
65-75%
90%+ with unified AI
±25% error to ±10% error
Sales Cycle Reduction
Varies by segment
16-day cycles achieved
30 days to 16 days (SMB)
A Forrester Total Economic Impact study found a composite organization experienced 481% ROI over three years with $10M net present value. Client testimonials report close rates more than doubling when AI functionality is fully adopted. Teams using unified AI tools see 25% higher forecast accuracy, preventing slippage and enabling managers to prioritize opportunities strategically.
Q5: How Much Time Can Revenue Intelligence Save Your Team? (Rep & Manager Productivity) [toc=Time Savings & Productivity]
Time savings represent the "middle-layer" ROI justification (easier to quantify than revenue attribution yet more tangible than soft cultural benefits). Industry benchmarks suggest revenue intelligence solutions save 10% of total time for sales reps and managers, but delivery mechanisms vary dramatically between platforms.
⏰ The Manual Labor Burden
Legacy revenue intelligence tools require extensive human effort to extract value:
For Sales Reps (2-3 hours weekly):
Manual CRM field updates after every call (Economic Buyer, Champion, Next Steps, MEDDPICC criteria)
Reviewing AI-generated summaries to copy-paste relevant details into opportunity notes
Searching through call transcripts to find specific customer objections or feature requests
For Sales Managers (8-12 hours weekly):
Listening to call recordings after-hours to audit rep performance
Manually reviewing pipeline health across 8-12 direct reports
Consolidating individual forecasts into team-level projections
For RevOps Teams (4-6 hours weekly):
Running weekly "roll-up" sessions where managers verbally update forecasts from spreadsheets
Debugging CRM data quality issues caused by inconsistent manual entry
Building custom reports because standard dashboards don't answer leadership questions
"I find the setup process challenging, especially when migrating fields from Salesforce... This requires creating and maintaining duplicate fields, which adds complexity and workload." Josiah R., Head of Sales Operations, G2 Verified Review
✅ Autonomous Execution vs. Data Presentation
The AI-era standard shifts from "showing humans what to do" to "AI performing the execution autonomously." Instead of dashboards highlighting missing CRM fields, AI agents populate them. Instead of flagging stalled deals, AI agents draft the re-engagement email. This represents a fundamental architectural difference: agentic automation replaces human-in-the-loop workflows.
💸 Oliv.ai's Time-Saving Agent Architecture
We've designed role-specific agents that eliminate manual workstreams entirely:
CRM Manager Agent Automatically updates actual Salesforce/HubSpot fields (not notes, but properties like Economic Buyer, Champion, and MEDDPICC scores). Saves reps 2-3 hours per week previously spent on post-call admin. Unlike Gong's activity logging (which adds notes), our CRM Manager updates structured fields critical for downstream reporting.
Forecaster Agent Performs autonomous bottom-up forecasting by inspecting every deal's health signals (eliminating Clari's manual roll-up sessions). Saves managers 4-6 hours weekly consolidating spreadsheets. RevOps leaders gain real-time forecast visibility without running weekly audits.
Analyst Agent Answers ad-hoc strategic questions in plain English across the entire pipeline: "Why did we lose all fintech deals this quarter?" or "Which reps have the highest multi-threading rates?" Eliminates custom report requests that previously took RevOps 2-3 days to fulfill.
Voice Agent Unique capability: AI calls reps for 5-minute check-ins to fill data gaps that meetings didn't capture ("Did they mention budget timeline?"). Prevents incomplete CRM records without adding rep burden.
"It's too complicated, and not intuitive at all... Searching for calls is not easy, moving around in the calls is not easy, and understanding the pipeline management portion of it is almost impossible." John S., Senior Account Executive, G2 Verified Review
⭐ High-Velocity Sales Visibility
In high-velocity SMB sales environments (20-25 day cycles), managers physically cannot audit enough calls to maintain pipeline visibility across 10+ reps. Our agents deliver "one day per week" of management time back (shifting focus from pipeline auditing to strategic coaching). Instead of spending Friday afternoons reviewing calls, managers receive Sunset Summaries highlighting only deals requiring intervention.
Cumulative time savings across a 25-person sales team:
Q6: Revenue Intelligence ROI by Company Size: SMB vs. Mid-Market vs. Enterprise [toc=ROI by Company Size]
Revenue intelligence ROI expectations, payback periods, and cost-benefit analyses vary significantly by company size. Each segment prioritizes different metrics and faces distinct implementation challenges that directly impact return calculations.
Revenue intelligence ROI calculation segmented by company size, showing annual investment ranges, payback periods, win rate improvements, incremental revenue, and time savings for SMB, mid-market, and enterprise organizations.
💰 SMB (5-20 Sales Reps)
Typical Profile:
Annual revenue: $2M-$20M
Sales team structure: 1-2 managers, 5-20 individual contributors
Sales cycle: 15-45 days (high velocity)
Average deal size: $5K-$50K
Primary ROI Drivers:
Manager leverage: Single manager cannot physically review 15-20 reps' calls; AI fills visibility gap
Rapid onboarding: 50% faster ramp time through AI-generated call libraries and coaching
CRM hygiene: Preventing data quality issues that plague early-stage reporting
Cost Considerations:
Platform budget: $15,000-$40,000 annually
Implementation: Minimal (1-5 days for cloud-native platforms)
RevOps overhead: Often no dedicated RevOps; founder or sales leader administers
Expected Payback Period: 6-9 months when adoption exceeds 70%
ROI Benchmarks:
Win rate improvement: 15% to 20% (+33% relative gain)
Time savings: 3 hours/week/rep = 240 hours/month for 20-person team
Forecast accuracy: 60% to 85% (+25 percentage points)
"It was a big mistake on our part to commit to a two year term... it's probably the highest end option on the market... all have said the same thing – they've been fine using a lower cost, simpler alternative." Iris P., Head of Marketing, Sales & Partnerships, G2 Verified Review
SMB Caution: Avoid over-engineered enterprise platforms (Gong, Clari) that require extensive RevOps support. Many SMBs pay $50K+ annually but use only basic call recording (features like advanced forecasting remain unused due to configuration complexity).
⭐ Mid-Market (20-100 Sales Reps)
Typical Profile:
Annual revenue: $20M-$200M
Sales team structure: 3-8 managers, 20-100 reps, 1-3 RevOps personnel
Implementation: 8-16 weeks for traditional platforms; 2-7 days for AI-native solutions
RevOps overhead: 0.5-1.5 FTE dedicated to platform administration
Expected Payback Period: 9-12 months when utilization stays above 75%
ROI Benchmarks:
Incremental revenue: $500K-$2M annually from win rate gains and deal acceleration
Manager productivity: 8 hours/week saved per manager × 5 managers = $120,000 annual value
RevOps efficiency: Eliminate 6 hours/week in manual roll-up meetings
"Love the user-friendly features and the visibility it provides into our Sales forecast... I'm able to screen-share Clari directly with our executive team because it presents the forecast in a clear, concise, and streamlined view." Andrew P., Business Development Manager, G2 Verified Review
✅ Enterprise (100+ Sales Reps)
Typical Profile:
Annual revenue: $200M+
Sales team structure: 10+ managers, 100-500+ reps, 5-15 RevOps personnel
Sales cycle: 90-180+ days
Average deal size: $100K-$5M+
Primary ROI Drivers:
Organizational alignment: Preventing information silos across global teams
Compliance & governance: Recording retention, data security, regulatory requirements
Executive dashboarding: Board-ready analytics with drill-down capability
Expected Payback Period: 12-18 months due to longer implementation cycles
ROI Benchmarks:
Enterprise deployments often achieve $5M-$15M incremental revenue over 3 years
Forrester TEI: 481% ROI, $10M NPV for composite 250-user organization
Time savings: 150+ hours weekly across organization = $400K+ annual labor value
Enterprise Caution: Total cost of ownership often reaches $1.6M over 3 years for incumbent platforms when including hidden costs (RevOps FTE, training, custom integrations, annual price increases).
📊 Company Size Comparison Table
ROI Comparison by Company Segment
Segment
Team Size
Annual Cost
Payback Period
Primary Benefit
SMB
5-20 reps
$15K-$40K
6-9 months
Manager leverage
Mid-Market
20-100 reps
$60K-$200K
9-12 months
Forecast accuracy
Enterprise
100+ reps
$250K-$1M+
12-18 months
Organizational alignment
How Oliv.ai Adapts to Each Segment: Our modular pricing allows SMBs to start with core agents (CRM Manager, Deal Driver) without paying for unused enterprise features. Mid-market teams add Forecaster and Analyst agents as complexity grows. Enterprise deployments leverage our instant implementation (vs. 24-week Gong rollouts) and pay-per-agent model to optimize costs across different sales roles.
Q7: What is Your Time-to-Value and Payback Period? [toc=Time-to-Value & Payback]
Understanding when revenue intelligence investment breaks even is critical for CFO approval. Time-to-value follows a predictable accumulation curve with distinct milestone phases.
Four-phase revenue intelligence implementation roadmap spanning 365 days, detailing foundation (CRM hygiene), acceleration (win rate improvement), optimization (forecast accuracy), and maturity stages with cumulative ROI percentages and key outcomes.
⏰ Month 1-30: Quick Wins (Foundation Phase)
Primary Value Drivers:
CRM data hygiene improvements: Automated field population eliminates 80%+ of manual data entry errors within first 2 weeks
How Oliv.ai Accelerates Time-to-Value: Our instant deployment (5 minutes to 2 days vs. 8-24 weeks for traditional platforms) moves teams into the Acceleration Phase immediately. Autonomous agents begin delivering value on Day 1 (no manual tracker configuration or lengthy training required). Mid-market teams typically achieve break-even in 9-12 months with 75%+ utilization, compared to 18-24 months for incumbent platform stacks.
Q8: How Do Leading Platforms Compare on ROI? (Gong, Clari, Salesforce, Oliv.ai) [toc=Platform ROI Comparison]
Evaluating revenue intelligence ROI requires comparing four critical dimensions: 3-year total cost of ownership, implementation timeline, RevOps FTE requirements, and typical payback periods. Many organizations underestimate TCO by focusing solely on subscription costs while ignoring operational overhead. Stacking multiple tools (Gong for conversational intelligence plus Clari for forecasting) can reach $500 per user per month, making platform consolidation a significant ROI variable.
Comprehensive revenue intelligence platform comparison displaying 3-year TCO, implementation timelines, RevOps requirements, and payback periods for Gong, Clari, Salesforce Einstein, and Oliv.ai across 250-user mid-market deployments.
❌ Incumbent Platform Limitations
Gong: The High-Cost Market Leader Gong's comprehensive suite costs approximately $1.6M over three years for a 250-user mid-market team when bundling conversational intelligence, forecasting, and engagement modules. Implementation requires 8-24 weeks and 1-1.5 RevOps FTE for ongoing management. While Gong offers robust analytics, users report data silos (insights live in Gong's proprietary UI rather than flowing back to the CRM as the single source of truth).
"While Gong offers valuable insights... our experience has been impacted by significant data access limitations... it requires downloading calls individually, which is impractical." Neel P., Sales Operations Manager, G2 Verified Review
Clari: Manual Roll-Up Forecasting Clari's forecasting remains highly regarded but fundamentally manual. RevOps teams still spend 4-6 hours weekly running "roll-up" sessions where managers verbally update spreadsheet-based forecasts. Their Copilot conversational intelligence product lags competitors significantly. Mid-market implementations cost $100K-$250K annually with 12-16 week deployment timelines.
Salesforce Einstein & Agentforce: The Data Hygiene Problem Salesforce's AI agents fail because they operate on "dirty data." Einstein Activity Capture misses interactions, unnecessarily redacts information, and stores emails in separate AWS instances unusable for downstream reporting. Agentforce focuses primarily on B2C use cases (retail support agents) with a chat-based UX that requires SDRs to "talk to a bot" rather than integrating natively into workflows.
Salesloft/Outreach: Built for a Dying Era These engagement platforms were architected for mass, non-personalized prospecting (an approach ending due to Google and Microsoft crackdowns on bulk cold emails). Their conversational intelligence modules are poorly built, often capturing only calls made through their dialers, missing external Zoom/Teams meetings entirely.
✅ The AI-Native Consolidation Opportunity
Modern platforms consolidate conversational intelligence + forecasting + engagement into unified, generative AI-native engines with instant deployment. The paradigm shift moves from "noisy platforms generating many alerts" to "actionable intelligence delivered right on time" via Slack and email (eliminating the need for managers to "dig through dashboards").
💰 Oliv.ai's Differentiated ROI Model
Free Baseline Layer We offer the "Gong replacement layer" (recording and transcription) free to existing Gong users. This commoditized functionality should not command premium pricing in 2025.
Modular Agent Pricing Pay only for agents you deploy:
CRM Manager for automated field updates (saves 2-3 hours/week/rep)
Forecaster Agent for autonomous bottom-up forecasting (eliminates manual roll-ups)
Deal Driver for managers (proactive pipeline alerts)
Retention Forecaster for CS teams only (no wasted licenses on sales reps)
Instant Implementation: 5 Minutes to 2 Days Traditional platforms require 8-24 weeks for full deployment. Our AI-native architecture configures in 5 minutes to 2 days (teams start seeing value immediately without lengthy change management programs).
CRM as Single Source of Truth Unlike Gong's data silos, our agents update actual CRM fields/properties (Economic Buyer, Champion, MEDDPICC scores) (not just activity notes). This "open export" approach ensures downstream reporting, forecasting, and automation workflows function properly.
Deep Contextual Research Our Researcher Agent performs account-level intelligence (detects new CRO hires, office openings) and drafts context-rich value propositions (versus generic sequence-based outreach from Salesloft/Outreach).
Mid-market teams report 9-12 month payback periods with Oliv.ai when utilization stays above 75%, compared to 18-24 months for incumbent stacks (a 40-50% faster break-even timeline driven by instant deployment and autonomous agent execution).
Q9: What Are Risk-Adjusted ROI Scenarios? (Best Case, Base Case, Conservative Case) [toc=Risk-Adjusted Scenarios]
CFOs require probability-weighted ROI models that account for implementation risks, adoption challenges, and variable outcomes. Rather than presenting a single optimistic projection, sophisticated business cases present three scenarios reflecting realistic outcome distributions.
📊 The Three-Scenario Framework
Best Case (80th Percentile Outcomes) Assumes optimal conditions and represents the top 20% of implementation results.
Adoption Profile:
User adoption rate: 90%+ within 90 days
Executive sponsorship: Active CRO/VP Sales engagement
Change management: Dedicated enablement resources
Data quality: Clean CRM with >85% field completion pre-implementation
Expected Outcomes:
Win rate improvement: +30-35%
Time savings: 3+ hours/week per rep
Forecast accuracy: 92-95%
Payback period: 6-9 months
Probability: 15-20% of implementations achieve this tier
Base Case (Median Outcomes) Represents the 50th percentile (typical results with standard implementation approach).
Adoption Profile:
User adoption rate: 75% within 120 days
Executive sponsorship: Supportive but not deeply engaged
Change management: Standard onboarding, limited ongoing training
Data quality: Moderate CRM hygiene requiring 30-60 day cleanup
Expected Outcomes:
Win rate improvement: +20-25%
Time savings: 2-2.5 hours/week per rep
Forecast accuracy: 88-90%
Payback period: 9-12 months
Probability: 50-60% of implementations achieve this tier
Executive sponsorship: Minimal; viewed as "RevOps project"
Change management: Limited training; reps view as surveillance tool
Data quality: Poor CRM hygiene; requires 90+ day remediation
Expected Outcomes:
Win rate improvement: +10-15%
Time savings: 1-1.5 hours/week per rep
Forecast accuracy: 80-85%
Payback period: 15-18 months
Probability: 20-30% of implementations land in this tier
⚠️ Implementation Failure Factors
Top 5 Risks That Degrade ROI:
Rep resistance ("Big Brother" perception): 25-40% adoption loss when positioned as management surveillance vs. rep enablement tool
Dirty CRM data: AI models require 85%+ field completion; poor hygiene delays value by 2-4 months
Integration complexity: Custom Salesforce objects or multi-CRM environments add 6-12 weeks to deployment
Lack of executive sponsorship: Without CRO/VP Sales mandate, adoption plateaus at 50-60%
Tool fatigue: Adding 8th or 9th sales tool creates workflow disruption and drives low utilization
"The platform is missing a ton of features and functionality that I've had with other tools... The workflow is clunky and confusing." Austin N., SDR, G2 Verified Review
📈 Probability-Weighted ROI Calculation Example
Mid-Market Team (50 reps, $150K annual investment):
Probability-Weighted ROI Calculation Example
Scenario
Probability
Year 1 Benefit
Weighted Value
Best Case
20%
$450K
$90K
Base Case
60%
$300K
$180K
Conservative
20%
$150K
$30K
Expected Value
100%
-
$300K
Risk-Adjusted ROI: ($300K - $150K) / $150K = 100% Year 1 ROI Risk-Adjusted Payback: 12 months (vs. 9 months in pure base case)
✅ Improving Scenario Outcomes
Actions to Move from Conservative to Base Case:
Secure executive sponsor who actively promotes tool in team meetings
Invest 2-4 weeks in CRM data cleanup before platform deployment
Position as "rep enablement" (coaching, time savings) not "manager oversight"
Start with 2-3 high-impact use cases vs. attempting full feature rollout
Actions to Move from Base Case to Best Case:
Dedicate 0.5 FTE change management resource for first 90 days
Create "power user" champions who evangelize success stories
Integrate platform metrics into comp/quota attainment discussions
Conduct monthly adoption reviews with metrics-based accountability
How Oliv.ai Reduces Implementation Risk: Our instant deployment (2-7 days) and autonomous agent architecture minimize two primary failure modes: lengthy implementation projects that lose momentum, and platforms requiring extensive manual configuration that never achieve full utilization. By delivering value on Day 1, we move teams into Base Case scenarios by default.
Q10: What Are the Intangible ROI Benefits? (Retention, Alignment, Handoffs) [toc=Intangible Benefits]
Beyond quantifiable time savings and revenue gains, revenue intelligence platforms deliver strategic value through organizational improvements that compound over time.
The AE-to-CSM transition represents a critical failure point where context gets lost. Traditional approaches require CSMs to "start from scratch," reviewing past emails and call notes to understand customer pain points, success criteria, and decision-maker relationships. AI-powered handoff automation preserves institutional knowledge:
Key improvements:
Pain point documentation: Automatically surfaced from discovery and demo calls
Success metrics tracking: Identified commitments and business outcomes customer expects
Stakeholder mapping: Champion, economic buyer, and technical evaluator relationships pre-populated
Implementation risks: Flagged concerns mentioned during sales cycle
CSMs inherit complete deal context on Day 1, reducing onboarding friction by 40-60% and accelerating time-to-value for customers.
✅ Talent Retention Through Administrative Burden Reduction
Top performers leave when administrative work crowds out selling time. Manual CRM updates, post-call note-taking, and pipeline hygiene tasks contribute to rep burnout:
Retention impact factors:
Role satisfaction: Reps spend 65-75% of time on revenue-generating activities vs. 50-55% industry baseline
Manager quality: When managers coach instead of audit, team engagement increases 25-35%
Replacing a mid-level AE costs $75K-$150K (recruiting, onboarding, ramp time). Reducing attrition by just 2-3 reps annually offsets significant platform investment.
💰 Sales-Marketing Alignment on Message Effectiveness
Marketing teams operate blind without systematic conversation intelligence. Revenue intelligence platforms bridge the gap:
Alignment improvements:
Content performance: Which whitepapers/case studies resonate in actual sales conversations?
Competitive positioning: Real-world objections to refine messaging
ICP validation: Characteristics of deals progressing fastest through pipeline
Feature prioritization: Product requests mentioned across customer base
"It's good for listening to calls and finding out what was said and how it was said... you can ensure that you get things right or you have backup to help correct a situation." John S., Senior Account Executive, G2 Verified Review
⚠️ The "Human Tendency" Problem: Surfacing Hidden Pipeline Risks
In weekly pipeline reviews, reps control the narrative (highlighting deals they're confident about while downplaying stalled opportunities). Managers need AI to surface what reps aren't volunteering:
AI-flagged risk indicators:
Champion disengagement (14+ days since last interaction)
Economic buyer never identified in 60+ day sales cycle
Multi-threading absence (only 1 contact engaged)
Competitive threats mentioned but not addressed
Budget/timeline conversations avoided
This "truth-telling" capability prevents surprises at quarter-end when managers discover deals were never truly qualified.
📊 Data Quality Improvements Enabling Downstream Automation
How Oliv.ai Amplifies Intangible Benefits: Our agent-first architecture addresses these soft ROI factors systematically. The CRM Manager agent ensures 95%+ field completion, eliminating downstream data quality issues. Our Deal Driver surfaces hidden pipeline risks that reps avoid discussing. The Researcher agent enables marketing teams to track message effectiveness across the entire customer base (not just sampled calls).
Q11: How to Track Post-Implementation ROI? (30-Day, 90-Day, 180-Day KPIs) [toc=Post-Implementation Tracking]
Proving realized ROI requires systematic measurement at key implementation milestones. Establish baseline metrics pre-deployment, then track improvement trajectories monthly.
⏰ 30-Day Metrics: Foundation & Adoption
Focus on platform utilization and initial data quality improvements.
Primary KPIs:
User adoption rate: Target 70-80% weekly active users
Measurement: Unique users logging in / total licensed users
Red flag threshold: <60% indicates resistance or training gaps
CRM data completeness: MEDDPICC/BANT field population
Measurement: Opportunities with all required fields / total opportunities
Success target: 85%+ completion (up from typical 30-40% baseline)
Call capture rate: Percentage of scheduled meetings recorded
Measurement: Recorded calls / calendar-synced meetings
How Oliv.ai Simplifies ROI Tracking: Our built-in analytics dashboard provides real-time visibility into all key metrics without requiring custom Salesforce reports or third-party BI tools. Track adoption, efficiency gains, and revenue impact in a single view (enabling RevOps teams to prove value monthly without building complex reporting infrastructure).
Q12: How to Build Your Revenue Intelligence Business Case (Step-by-Step Framework + Templates) [toc=Building Business Case]
Creating a compelling business case requires translating platform capabilities into stakeholder-specific value propositions. Different executives prioritize different metrics.
📝 Step 1: Gather Baseline Metrics (Week 1)
Document current-state performance across key dimensions:
Revenue metrics:
Current win rate (last 4 quarters)
Average sales cycle length
Quota attainment percentage (team-wide)
Forecast accuracy variance
Efficiency metrics:
Hours/week reps spend on CRM updates
Manager time spent reviewing calls/pipeline
RevOps hours on forecasting consolidation
Data quality metrics:
CRM field completion rates (MEDDPICC, contact roles, next steps)
Percentage of opportunities missing key qualification data
Export 12 months of Salesforce data to establish credible baselines. Avoid estimates (CFOs reject business cases built on "gut feel" numbers).
💰 Step 2: Build Financial Model (Week 1-2)
Create a 3-year projection spreadsheet with these components:
Cost inputs:
Platform subscription (Years 1-3 with 5-10% annual increases)
"Gong has become the single source of truth for our sales team... The product is constantly evolving so it feels like Gong is one-step ahead." Scott T., Director of Sales, G2 Verified Review
⭐ Step 5: Prepare ROI Calculator Template (Week 3)
Create a downloadable Excel template with:
Tab 1: Input Variables
Team size (reps, managers, RevOps)
Current performance metrics (win rate, cycle time)
Cost assumptions (platform, implementation)
Tab 2: Benefit Calculations
Revenue impact formulas (auto-calculated)
Time savings by role
Total 3-year value projection
Tab 3: Scenario Analysis
Best case / Base case / Conservative case outputs
Sensitivity analysis (what if win rate only improves 10%?)
Tab 4: Implementation Checklist
Pre-launch tasks (integration, training)
30/60/90-day milestones
Success metrics to track
📋 Implementation Checklist with ROI Milestones
Pre-Launch (Weeks 1-4):
✅ CRM integration configured
✅ User accounts provisioned
✅ Initial training completed
✅ Success metrics baseline documented
Month 1-3:
✅ 75%+ adoption achieved
✅ CRM data quality improves to 85%+
✅ Time savings quantified
Month 4-6:
✅ Win rate shows +10-15% improvement
✅ Coaching frequency doubled
✅ Forecast accuracy hits 85%+
Month 7-12:
✅ Full ROI realized
✅ Payback period achieved
✅ Executive review confirms value
How Oliv.ai Accelerates Business Case Creation: We provide ready-made ROI calculator templates, stakeholder presentation decks, and implementation checklists tailored to your company size. Our Customer Success team conducts value workshops to help you build defensible financial models with industry benchmarks (shortening business case development from 3-4 weeks to 5-7 days).
FAQ's
What is a revenue intelligence ROI calculator and why do I need one?
A revenue intelligence ROI calculator is a financial modeling framework that quantifies the measurable return from platforms that capture, analyze, and act on customer-facing interactions. In 2025, calculating ROI has fundamentally shifted beyond simple "cost per user" metrics to comprehensive Total Economic Impact models covering revenue gains, efficiency improvements, risk mitigation, and strategic flexibility.
We built our ROI calculator to address the specific challenge RevOps leaders face when presenting to CFOs: justifying $150K-$1M+ annual investments requires defensible projections, not vendor-provided case studies. Our framework includes baseline metric collection (current win rates, sales cycle length, forecast accuracy), benefit calculations across three scenarios (best case, base case, conservative), and stakeholder-specific value propositions tailored for CFOs (payback periods), CROs (pipeline visibility), and RevOps teams (operational efficiency).
The calculator accounts for both hard costs (subscription fees, implementation, training) and hidden costs often missed in initial budgets (RevOps FTE overhead, integration complexity, data migration). Explore our pricing models to see how modular agent-based pricing differs from traditional platform licensing.
How do you calculate revenue intelligence ROI using the Total Economic Impact framework?
We use a four-pillar Total Economic Impact methodology that goes beyond simple ROI = (Benefits - Costs) / Costs formulas. The framework quantifies: (1) Direct Revenue Impact from win rate improvements (industry benchmarks show 20-35% gains), deal velocity acceleration (7% average), and forecast accuracy (90%+ vs. 65-75% baseline); (2) Efficiency Gains measuring time savings (2-3 hours/week per rep on CRM updates), manager productivity (reclaim 1 day weekly from call reviews), and RevOps automation (eliminate manual forecasting roll-ups); (3) Risk Mitigation Value including churn prevention, compliance assurance, and knowledge retention; and (4) Strategic Flexibility enabling scalability without proportional headcount increases.
Our calculator also incorporates Sales Velocity metrics: (Number of Opportunities × Average Deal Size × Win Rate) / Sales Cycle Length. Revenue intelligence platforms impact all four variables simultaneously, making velocity a more comprehensive success indicator than isolated win rate tracking.
For a 50-person mid-market team, a typical calculation might show: Year 1 benefits of $300K (incremental revenue + time savings + retention value) against $150K total costs (platform + implementation + training), yielding 100% Year 1 ROI with 12-month payback. Book a demo to run your specific team's numbers through our customized ROI model.
What are the hard costs vs hidden costs in revenue intelligence platforms?
Hard costs are visible in vendor quotes: platform licensing ($1,600-$2,400 per user annually for premium tools), base platform fees ($5K-$50K regardless of users), implementation/onboarding ($7,500-$150K depending on complexity), and training ($5K-$30K for team-wide enablement). For a 250-user mid-market deployment, these visible costs typically total $400K-$600K in Year 1.
Hidden costs often double the actual TCO and include: RevOps personnel (0.5-1.5 FTE at $40K-$120K annually to manage integrations, user permissions, and data flows), custom CRM integration ($2K-$15K for non-standard field mapping and multi-object syncing), data migration ($5K-$30K to import historical call recordings from previous tools), auto-renewal uplifts (5-15% annual price increases buried in contracts), and opportunity cost during lengthy implementations (8-24 weeks for traditional platforms means delayed value realization).
We've seen organizations budget $200K for a Gong deployment only to discover the true 3-year TCO reaches $1.6M when accounting for RevOps overhead, training refreshers, integration debugging, and compounding renewal increases. Our approach eliminates many hidden costs through instant deployment (2-7 days vs. 24 weeks), autonomous agent operation requiring minimal RevOps support, and transparent modular pricing. Start a free trial to experience implementation simplicity firsthand.
What ROI can I expect from revenue intelligence by company size?
ROI profiles vary significantly by segment. SMBs (5-20 reps) achieve 6-9 month payback periods focusing on manager leverage (single manager can't physically review 20 reps' calls without AI), rapid onboarding (50% faster ramp through AI-generated call libraries), and CRM hygiene preventing early-stage data chaos. Typical SMB investment: $15K-$40K annually with expected benefits of $30K-$80K (win rate 15% to 20%, 3 hours/week saved per rep).
Mid-market teams (20-100 reps) hit 9-12 month payback at 75%+ utilization, driven by forecasting accuracy (board-level pressure for predictable revenue), deal inspection rigor (MEDDPICC enforcement AI can automate), and cross-functional visibility. Investment: $60K-$200K annually, benefits: $120K-$400K (25% forecast accuracy gains, $500K-$2M incremental annual revenue).
Enterprise organizations (100+ reps) require 12-18 months due to complex implementations but achieve $5M-$15M incremental revenue over 3 years. Focus shifts to organizational alignment across global teams, compliance/governance requirements, and executive dashboarding. However, enterprise TCO often reaches $1.6M over 3 years for incumbent platform stacks when including hidden costs.
Our modular pricing allows SMBs to start with core agents (CRM Manager, Deal Driver) without paying for unused enterprise features, while mid-market teams add Forecaster and Analyst agents as complexity grows. See our pricing for segment-specific configurations.
How long is the typical payback period for revenue intelligence platforms?
Payback periods follow a predictable curve with distinct phases. Month 1-30 (Foundation Phase) delivers 5-10% of total annual value through CRM data hygiene improvements (MEDDPICC completion 30% to 85%), 100% call capture rates, and first-time complete pipeline visibility. Measurable: 1.5 hours/week saved per rep on admin tasks.
Month 31-90 (Acceleration Phase) contributes 20-30% of annual value via coaching impact (win rate +3-5 percentage points), systematic deal inspection, and early pipeline health signals identifying at-risk deals 3-4 weeks earlier than manual reviews. Sales cycles reduce by 5-7 days average.
Month 91-180 (Optimization Phase) adds 50-65% cumulative value as AI forecasting models achieve 90%+ accuracy with sufficient historical data, deal slippage prevention saves 2-4 at-risk accounts, and cross-functional alignment drives strategic insights. By Month 181-365 (Maturity Phase), teams realize 100% projected value with win rates +20-35% vs. baseline and manager leverage handling 20% more direct reports.
Critical success factors affecting time-to-value include executive sponsorship (cuts implementation time 40-50%), change management quality (proper training accelerates adoption 3-4 weeks), integration quality (clean CRM data enables faster AI accuracy), and use case prioritization (focus on 2-3 high-impact workflows first). Traditional platforms requiring 8-24 weeks for deployment delay these phases significantly. Explore our sandbox to see how instant configuration accelerates time-to-value.
How do I track post-implementation ROI at 30-day, 90-day, and 180-day milestones?
We recommend a phased KPI framework aligned to implementation maturity. At 30 days (Foundation Phase), track user adoption rate (target 70-80% weekly active users; <60% signals training gaps), CRM data completeness (85%+ MEDDPICC/BANT field population vs. 30-40% baseline), call capture rate (95%+ scheduled meetings recorded), and manager review frequency (4-5 dashboard sessions weekly). Early warnings: unchanged data quality indicates integration issues or reps bypassing workflows.
At 90 days (Acceleration Phase), measure efficiency gains: time saved on CRM updates (target 2-3 hours/week/rep), manager coaching frequency (2x pre-implementation baseline with deal-specific insights), pipeline inspection time reduction (-40-50%, from 8 hours to 4-5 hours weekly), and deal progression velocity (-10-15% days in each sales stage). These metrics prove operational ROI before revenue impact becomes statistically significant.
At 180 days (Maturity Phase), quantify revenue outcomes: win rate improvement (+15-25% relative gain, e.g., 20% to 23-25%), forecast accuracy (±10% variance vs. ±20-25% baseline), pipeline coverage ratio (3.5-4.5x through better qualification), average deal size (+5-10% from multi-threading/upselling), and sales cycle length (-15-20% reduction). Compare actual vs. projected ROI to diagnose adoption barriers if behind projections or accelerate additional use cases if ahead.
Our built-in analytics dashboard provides real-time visibility into all key metrics without requiring custom Salesforce reports or third-party BI tools, enabling RevOps teams to prove value monthly without building complex reporting infrastructure. Book a demo to see the tracking dashboard in action.
How does Oliv.ai's ROI compare to Gong, Clari, and Salesforce Einstein?
We deliver 40-50% faster payback periods (9-12 months vs. 18-24 months for incumbent stacks) through three fundamental architectural differences. First, instant deployment: traditional platforms require 8-24 weeks for full implementation, delaying value realization and risking momentum loss, whereas our AI-native architecture configures in 2-7 days with teams seeing Day 1 value from autonomous agents.
Second, consolidated platform economics: stacking Gong ($1,600/user annually for conversational intelligence) plus Clari ($100K-$250K annually for forecasting) reaches $500/user/month for mid-market teams, totaling $1.6M-$2M over 3 years when including RevOps overhead (1.5-2 FTE). We unify conversational intelligence, forecasting, and engagement in a single AI-native engine at $400K-$700K 3-year TCO with 0.5 FTE RevOps requirement, driven by modular agent pricing (pay only for agents deployed, e.g., giving Retention Forecaster only to CSMs, not all sales reps).
Third, agentic execution vs. dashboard dependency: Gong and Clari take reactive approaches (record calls, generate keyword trackers, populate dashboards, then wait for managers to interpret data and manually intervene). Our CRM Manager agent updates actual Salesforce fields/properties (Economic Buyer, Champion, MEDDPICC scores), not just activity notes, critical for downstream reporting. Our Forecaster agent performs autonomous bottom-up forecasting, eliminating Clari's manual "roll-up" sessions where RevOps spends 4-6 hours weekly consolidating manager spreadsheets.
For Salesforce Einstein comparison, their agents fail because they operate on "dirty data"—Einstein Activity Capture misses interactions and stores emails in separate AWS instances unusable for reporting. We position as the "data cleanup platform" using generative AI to fix CRM hygiene before agents run. Start your free trial to compare implementation speed and autonomous operation firsthand.
Enjoyed the read? Join our founder for a quick 7-minute chat — no pitch, just a real conversation on how we’re rethinking RevOps with AI.
Revenue teams love Oliv
Here’s why:
All your deal data unified (from 30+ tools and tabs).
Insights are delivered to you directly, no digging.
AI agents automate tasks for you.
Thank you! Your submission has been received!
Oops! Something went wrong while submitting the form.
Meet Oliv’s AI Agents
Hi! I’m, Deal Driver
I track deals, flag risks, send weekly pipeline updates and give sales managers full visibility into deal progress
Hi! I’m, CRM Manager
I maintain CRM hygiene by updating core, custom and qualification fields, all without your team lifting a finger
Hi! I’m, Forecaster
I build accurate forecasts based on real deal movement and tell you which deals to pull in to hit your number
Hi! I’m, Coach
I believe performance fuels revenue. I spot skill gaps, score calls and build coaching plans to help every rep level up
Hi! I’m, Prospector
I dig into target accounts to surface the right contacts, tailor and time outreach so you always strike when it counts
Hi! I’m, Pipeline tracker
I call reps to get deal updates, and deliver a real-time, CRM-synced roll-up view of deal progress
Hi! I’m, Analyst
I answer complex pipeline questions, uncover deal patterns, and build reports that guide strategic decisions
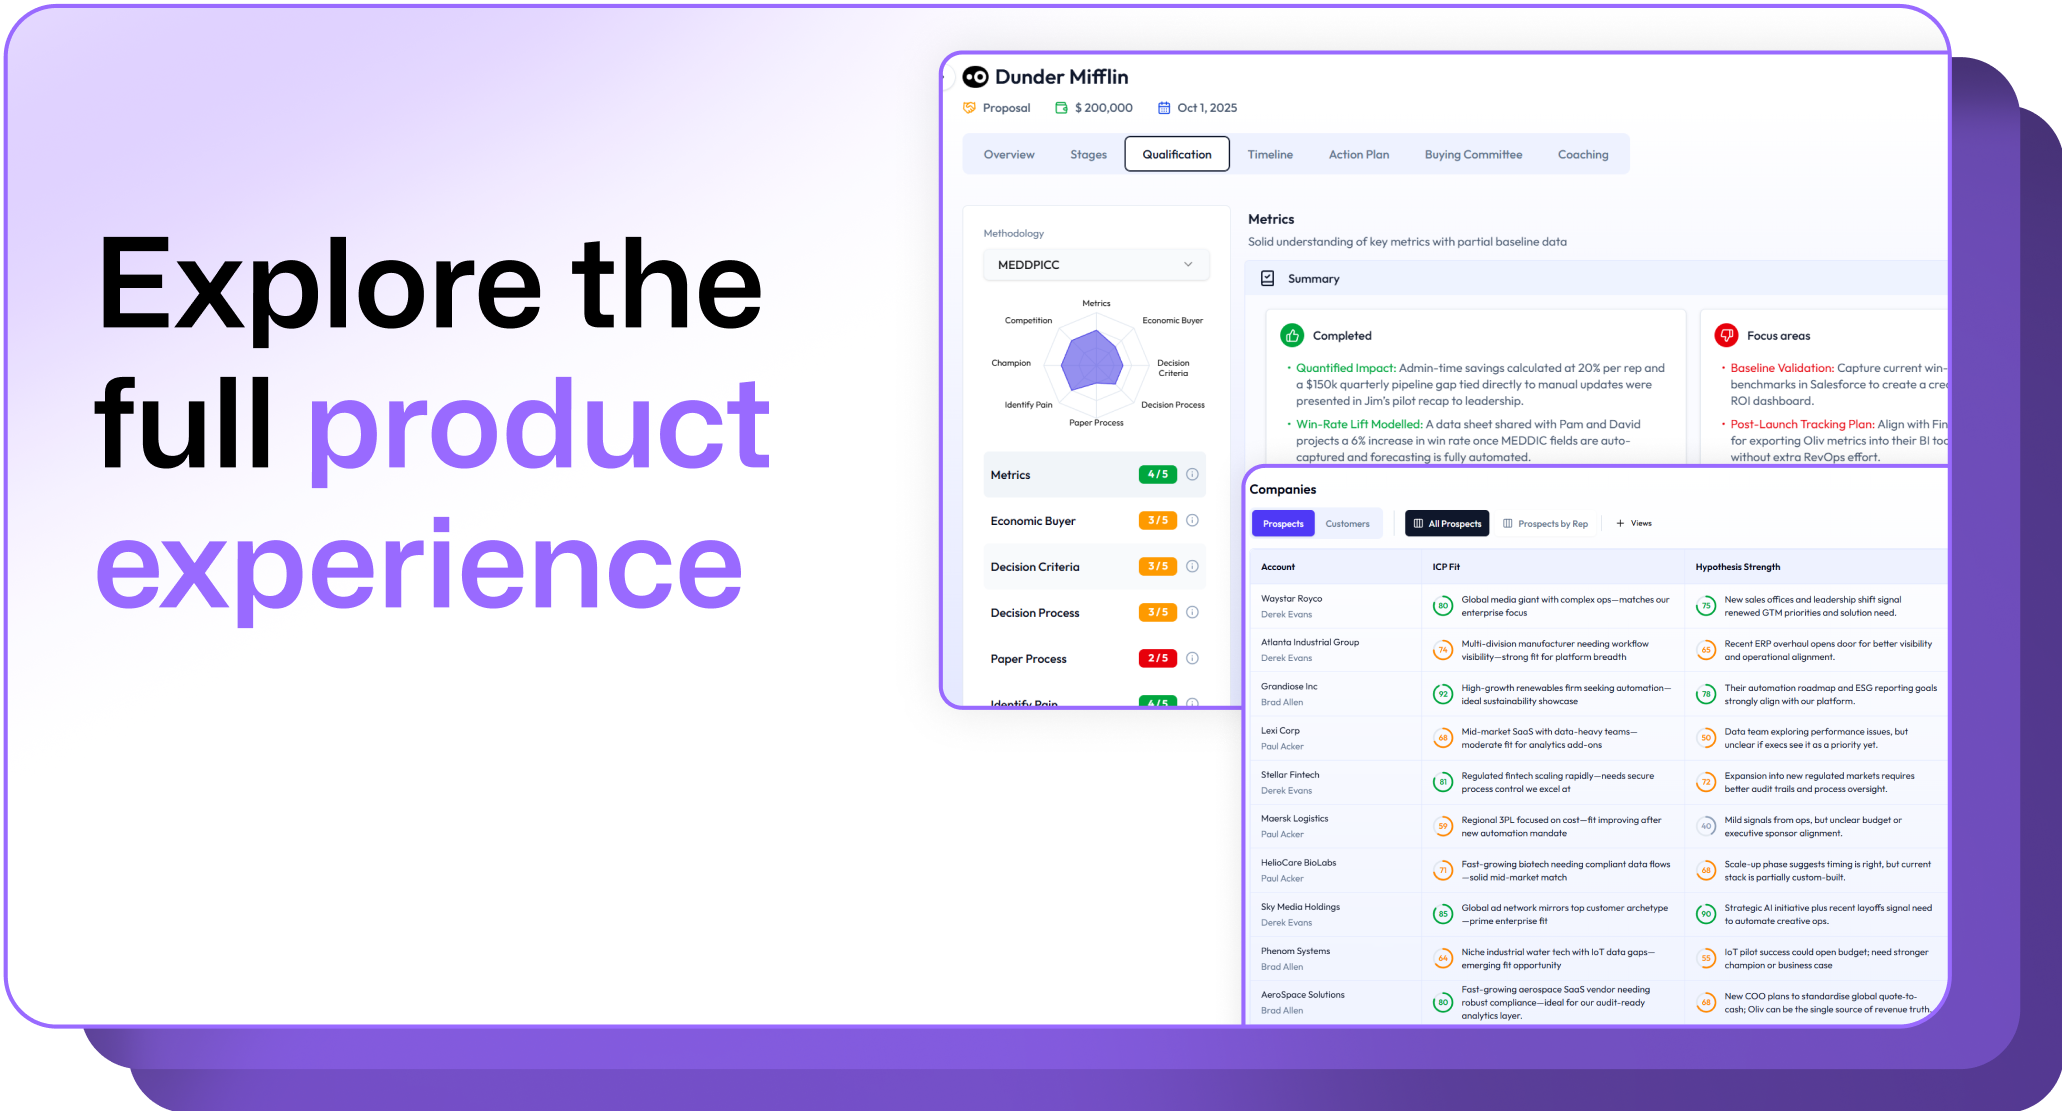
.avif)
.png)


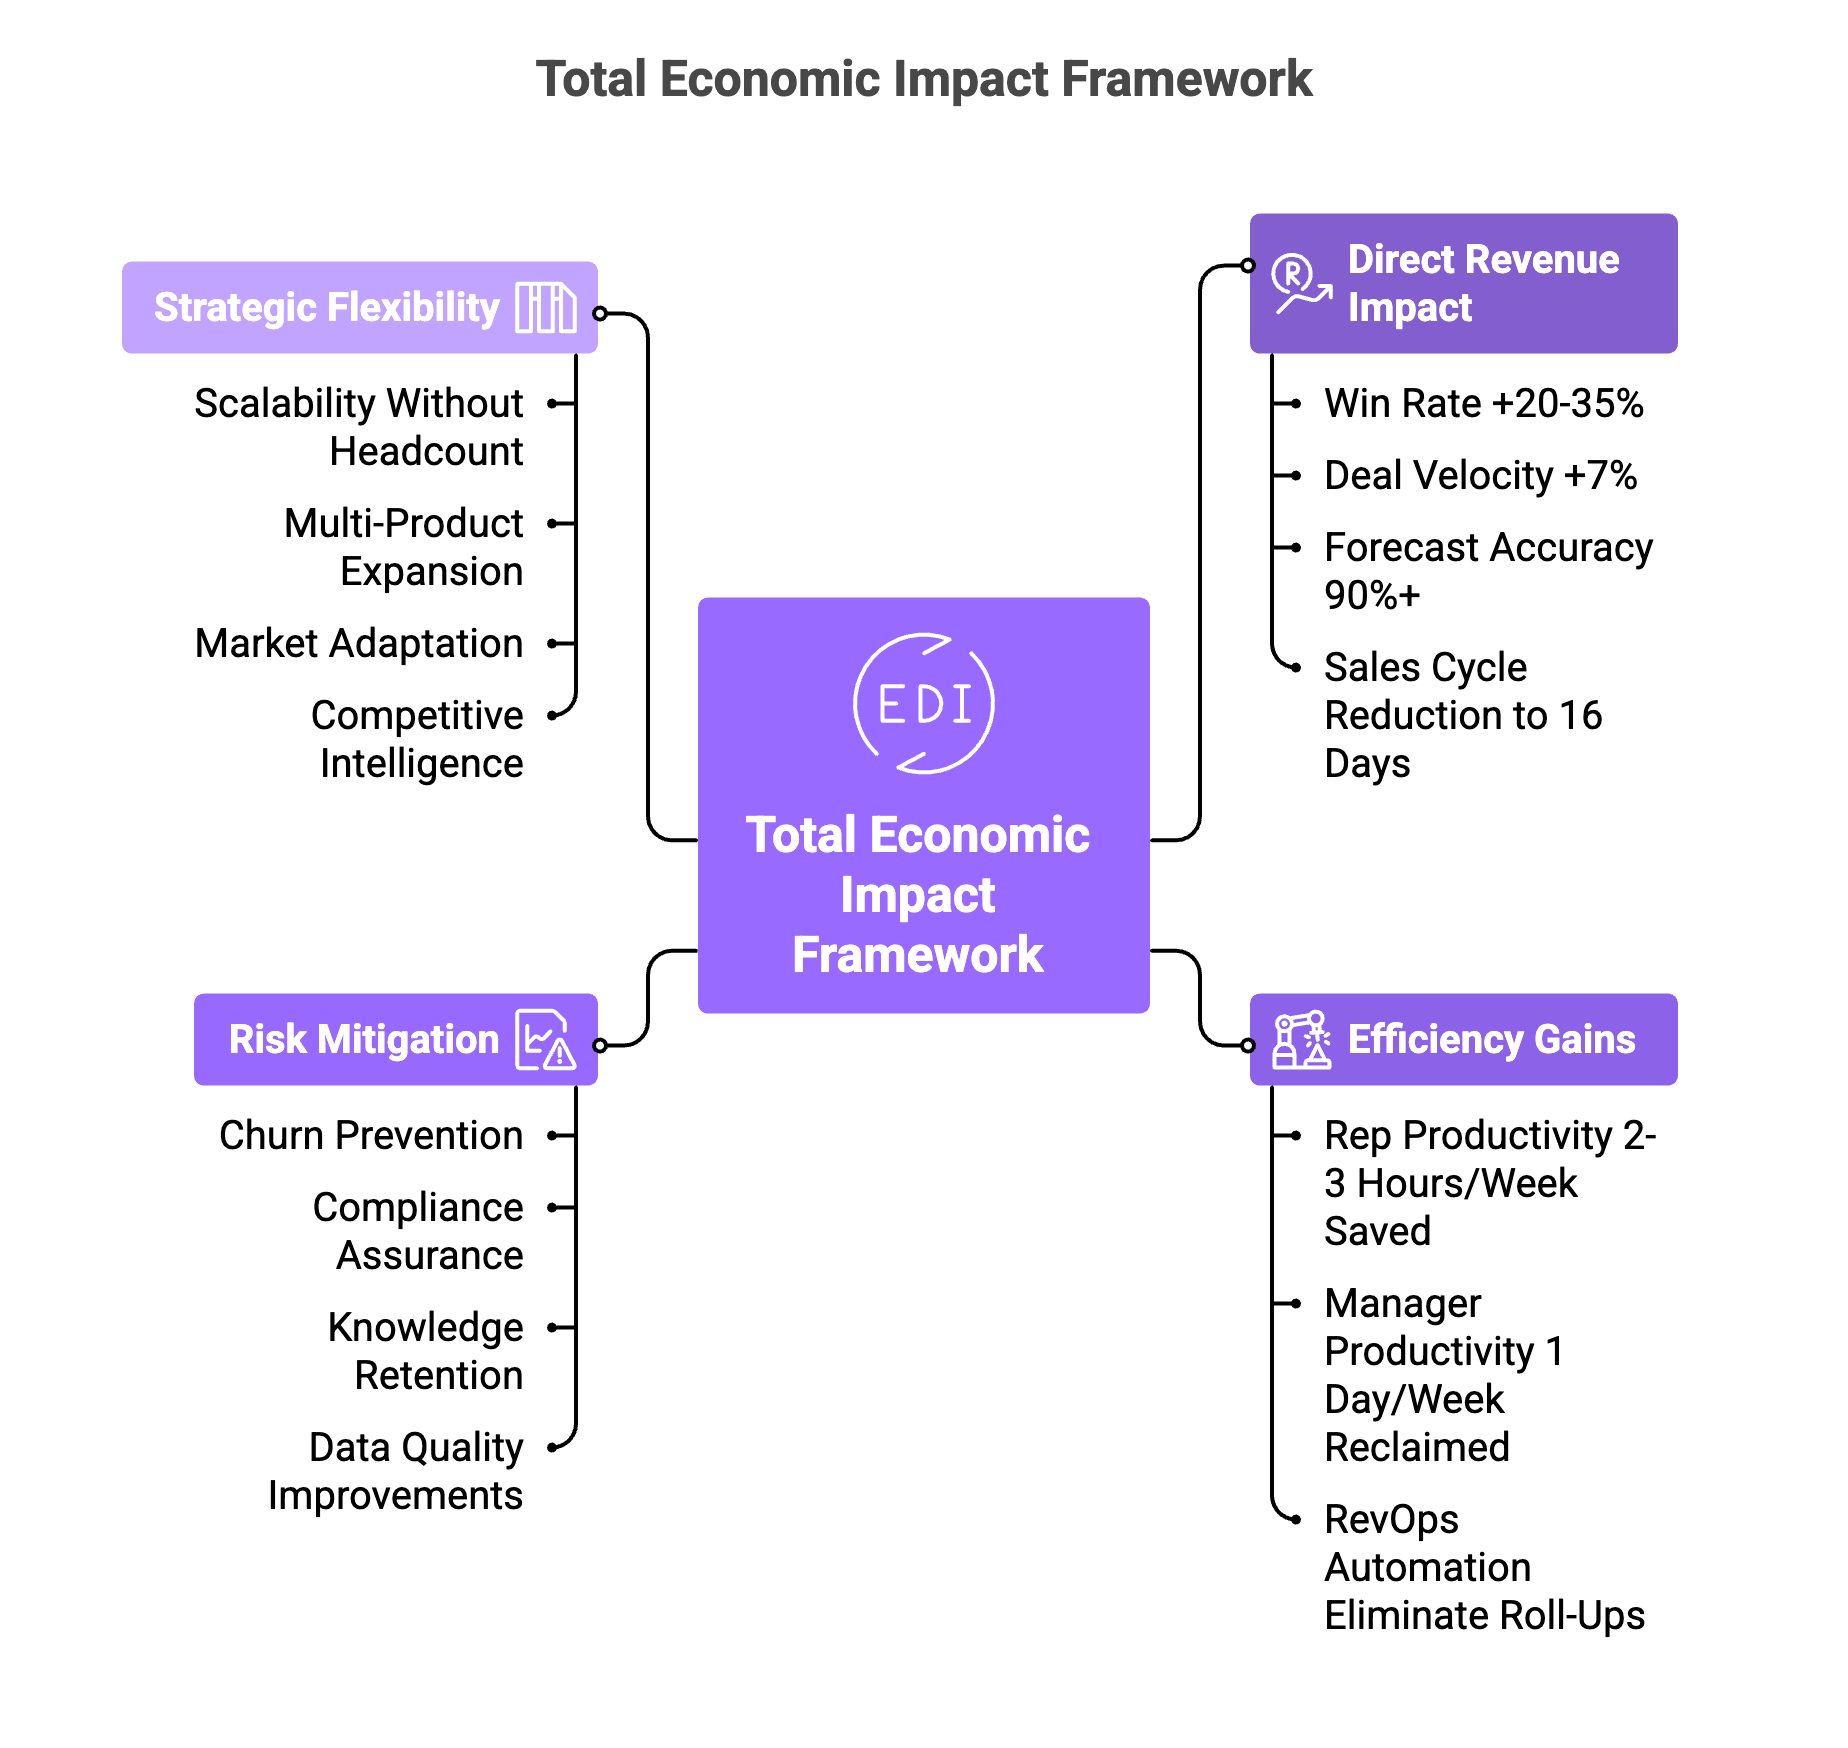
.png)
.png)
.png)

.png)
.png)
.png)
.png)

