The 67% Crisis: Average forecast accuracy fails due to dirty CRM data (67% of deals lack complete fields), rep optimism bias (20-30% over-estimation), and manual roll-up processes requiring 6+ hours weekly per manager.
90-Day Transformation: Organizations achieve 10-15% improvement in 30 days (data hygiene), 20-25% by day 60 (AI signal detection), and 25-30%+ by day 90 (autonomous forecasting), reaching 94-98% accuracy systematically.
AI vs. Traditional Stack: First-gen tools (Gong + Clari) cost $500/user and plateau at 80-85% accuracy using keyword trackers; AI-native platforms analyze 300+ contextual signals, flag risks 3.2 weeks earlier, and achieve 95-98% accuracy.
Troubleshooting Below 85%: Primary failure points are insufficient pipeline coverage (<3x quota), stale deals exceeding average stage duration by 1.5x, and methodology non-compliance requiring automated health scoring and velocity tracking.
Real ROI Beyond Accuracy: Companies report 15-23% shorter sales cycles, 8-12 point win rate increases, and 1 day per week manager time reclaimed, with accuracy improvements sustained through quarterly methodology audits.
Q1. Why Do Most Sales Forecasts Fail? (The 67% Accuracy Crisis) [toc=Forecast Failure Crisis]
Eighty-four percent of U.S. companies missed their revenue forecasts in at least one quarter last year, creating a crisis of confidence that ripples through board meetings, hiring decisions, and operational planning. The average sales forecast accuracy hovers at just 67%, a number that represents more than statistical underperformance. It signals a fundamental architectural failure in how revenue organizations capture, analyze, and predict pipeline outcomes. This "confidence gap" forces CFOs to maintain excessive cash reserves, causes premature headcount freezes, and erodes trust between sales leadership and executive teams.
The root cause isn't effort, it's infrastructure. For decades, CRM systems have been positioned as the "single source of truth" for revenue teams, yet they've systematically failed because they depend entirely on manual data entry. Sales reps prioritize closing deals over administrative tasks, treating CRM updates as compliance theater rather than value-generating work. The result is dirty data: incomplete qualification fields (67% of opportunities lack next steps), outdated stage progression (deals sitting in "Negotiation" for 90+ days), and missing stakeholder information that renders pipeline analysis meaningless.
"Before Gong we had a lack of visibility across our deals because information was siloed in several places like CRM, Email, Zoom, phone... Forecasting was also an ad-hoc process for us." — Scott T., Director of Sales G2 Verified Review
⏰ The Manager Tax: 6 Hours Weekly Spent Auditing Reality
This data crisis forces managers into a backwards-looking "review-based system" where they spend off-hours, often while driving home or in the shower, listening to call recordings to manually reconstruct what's actually happening in deals. They audit Gong transcripts, cross-reference email threads, and translate verbal commitments into spreadsheet updates, all to prepare for the dreaded Monday morning forecasting call. This manual archaeology consumes 6+ hours weekly per manager and still produces forecasts plagued by recency bias and rep optimism.
"It takes an eternity to upload a call to listen to it." — Remington Adams, Team Lead SDR TrustRadius Review
Traditional Revenue Intelligence tools (Gong, Clari) built in the 2015-2022 era attempted to solve this with keyword-based "Smart Trackers" and manual scorecards, but they merely digitized the problem rather than eliminating it. Gong's 20-30 minute recording delays mean insights arrive too late for same-day intervention. Clari's forecasting requires managers to spend Thursdays and Fridays sitting with reps to hear "deal stories," then manually input subjective assessments into the platform, a process users rate at just 4/10 effectiveness.
✅ The AI-Native Solution: Autonomous Data Capture
AI-native platforms eliminate this crisis through autonomous data capture and contextual stitching. Rather than waiting for reps to update fields or managers to audit recordings, agentic systems automatically track every interaction (calls, emails, Slack messages, calendar activity) and use LLM-based reasoning to determine which account, opportunity, and stage each interaction belongs to. Oliv AI's CRM Manager Agent, for example, auto-populates up to 100 custom qualification fields trained on methodologies like MEDDIC and BANT, removing human dependency entirely. The system proactively nudges reps via Slack to validate data before pushing updates, ensuring the CRM becomes an actual single source of truth rather than a graveyard of stale information.
Companies implementing agentic AI forecasting see accuracy jump from the 67% industry average to 94-98% within 90 days, as confirmed by CROs who've transitioned from manual roll-ups to autonomous systems. The transformation isn't incremental, it's architectural, replacing the broken foundation of manual data entry with continuous, context-aware intelligence that makes forecasting a byproduct of work rather than additional work.
Q2. How to Calculate Sales Forecast Accuracy (Formula + Benchmarks) [toc=Accuracy Calculation Formula]
Sales forecast accuracy measures how closely your predicted revenue matches actual closed revenue over a specific period. Understanding this metric and the benchmarks that define success is foundational to improving forecasting performance.
This formula treats over-forecasting and under-forecasting equally, which is critical since both create operational problems (over-forecasting leads to hiring too early; under-forecasting causes missed investment opportunities).
📊 Alternative Metric: MAPE (Mean Absolute Percentage Error)
For organizations forecasting across multiple periods or business units, MAPE provides a more nuanced view:
MAPE = (Σ |Actual - Forecast| / Actual) / n × 100
Where n = number of forecasting periods. Lower MAPE percentages indicate better accuracy. A MAPE of 10% means your forecast is off by 10% on average, which translates to 90% accuracy.
⭐ Industry Benchmarks: The Accuracy Ladder
67% - Industry Average (Failing Grade): Most B2B companies using manual forecasting methods or basic CRM reporting operate at this level. At 67% accuracy, a $10M forecast means actual results could range from $6.7M to $13.3M, a variance too wide for confident operational planning.
75-80% - Minimum Viable Accuracy: Companies using first-generation Revenue Intelligence tools (Gong, Clari) with consistent weekly review processes typically achieve this range. It's functional but still requires significant safety margins in planning.
85% - CFO Confidence Threshold: This is the benchmark where executive teams begin trusting forecasts for headcount decisions, budget allocation, and board commitments. Only 30% of companies consistently achieve 85%+ accuracy.
90-94% - Best-in-Class Manual Processes: Organizations with disciplined forecasting cadences, strong CRM hygiene, and experienced sales leadership can reach this level, but it requires significant manager time investment (6+ hours weekly per manager).
95-98% - AI-Powered Ceiling: Companies using AI-native forecasting systems that analyze conversational signals, stakeholder engagement patterns, and pipeline health automatically achieve this range. This level enables aggressive growth strategies with minimal risk buffering.
💰 Calculating Weighted vs. Unweighted Forecasts
Unweighted Forecast: Sum of all pipeline opportunities in "Commit" stage Weighted Forecast: Each opportunity value × stage probability
Most accurate forecasts use weighted methodology with probability percentages refined based on historical win rates by stage, not arbitrary industry averages.
⚠️ Common Calculation Mistakes
Including "Best Case" deals in committed forecasts - Inflates accuracy calculations by 15-25%
Not accounting for deal slippage - Deals that push from one quarter to the next distort accuracy metrics
Rather than manually calculating these metrics in spreadsheets, Oliv AI's Forecaster Agent automatically calculates forecast accuracy across multiple time horizons (weekly, monthly, quarterly) and presents trend analysis showing improvement over time. The system flags when accuracy dips below your target threshold and provides diagnostic insights into whether the issue stems from pipeline coverage, stage duration anomalies, or rep-specific forecasting patterns, eliminating guesswork from performance improvement.
Q3. What's the Difference Between Traditional and AI-Powered Sales Forecasting? [toc=Traditional vs AI Forecasting]
Traditional sales forecasting relies on manual "roll-ups" where managers meet with reps every Thursday and Friday to hear subjective "deal stories," then manually input those assessments into tools like Clari or Salesforce. This process produces 70-75% accuracy at best because it's plagued by rep optimism bias (reps consistently over-estimate close probabilities by 20-30%), delayed data capture (insights lag reality by 3-7 days), and manager interpretation variance (two managers hearing the same story produce different forecasts 40% of the time).
"Clari's process is notoriously manual. Sales managers must sit with reps on Thursdays and Fridays to hear the 'story' of a deal, then manually input that color into Clari to generate a report for the VP on Monday." — Andrew P., Business Development Manager G2 Verified Review
First-generation Revenue Intelligence tools (Gong, Clari circa 2015-2022) attempted to improve this with keyword-based "Smart Trackers," but these pre-generative AI systems fundamentally misunderstand context. Gong's trackers flag every mention of "budget" or "competitor" without distinguishing between a casual reference and active evaluation, producing low-signal noise that still requires manual interpretation. Users report 20-30 minute delays before call recordings are available for review, and the forecasting modules still demand managers manually fill out scorecards to identify gaps, essentially digitizing the old manual process rather than eliminating it.
💸 The Stacking Tax: $500+ Per User for Fragmented Tools
Because Gong's Conversation Intelligence doesn't provide strong forecasting and Clari's forecasting lacks robust call analysis, enterprises end up stacking both tools, resulting in a total cost of ownership exceeding $500 per user per month. Managers toggle between platforms, reconcile conflicting data, and still spend 6 hours weekly preparing for forecast calls.
"The additional products like forecast or engage come at an additional cost. Would be great to see these tools rolled into the core offering." — Scott T., Director of Sales G2 Verified Review
Side-by-side comparison demonstrating how AI-native forecasting achieves 95-98% accuracy with 2-hour weekly manager time versus traditional methods delivering 70-80% accuracy requiring 6+ hours weekly.
✅ AI-Powered Forecasting: Contextual Intelligence at Scale
AI-powered forecasting transforms accuracy through three architectural innovations. First, ML models analyze 300+ buying signals from conversation context, not keywords. Rather than flagging "budget" mentions, the system detects sentiment shifts when budget discussions occur (Is the prospect defensive? Engaged? Defering?), stakeholder engagement patterns (Are decision-makers ghosting or increasingly present?), and commitment language velocity (Are "maybes" becoming "yeses" or softening to "we'll circles backs?").
Second, these systems flag at-risk deals 3.2 weeks earlier than manual methods by detecting leading indicators invisible to keyword trackers: decreasing email response times, champion departure signals from LinkedIn activity, and stakeholder meeting cadence declines. This early warning system enables intervention when deals are still salvageable rather than post-mortem reporting after they've slipped.
Third, AI-powered forecasting eliminates human bias through unbiased algorithmic assessment. Where reps overestimate and managers apply inconsistent judgment, ML models trained on thousands of historical deal outcomes provide probability scores based on actual pattern recognition, not intuition.
🚀 Oliv AI's Dual ROI: Accuracy + Time Savings
Oliv AI's Forecaster Agent performs autonomous bottom-up analysis of every pipeline deal, inspecting qualification completeness, stakeholder engagement health, and stage duration anomalies. It generates unbiased AI commentary explaining precisely why each deal is flagged as "at risk" or "pull-in potential," and delivers presentation-ready one-page reports plus PPT/Google Slides decks every Monday morning. Managers receive insights directly in Slack, no dashboard login required, reducing forecast prep time from 6 hours to 2 hours weekly (65% reduction) while improving accuracy by 25%.
This delivers dual ROI: better numbers AND freed strategic time. Rather than auditing spreadsheets, managers focus on deal intervention strategies guided by AI-identified risk factors. The single platform replaces the Gong + Clari stack at one-fifth the cost, consolidating Conversation Intelligence, Revenue Intelligence, and autonomous forecasting into one agentic system.
Traditional tools provide post-mortem reporting; Oliv's early warning system (3.2 weeks earlier risk detection) enables proactive deal rescue, transforming forecasting from backward-looking compliance into forward-looking strategy.
Q4. How Does AI Analyze Conversations to Improve Forecast Accuracy? [toc=AI Conversation Analysis]
AI-powered conversation analysis transforms forecasting accuracy by examining what customers actually say rather than relying on what reps enter into the CRM. This shift from manual data entry to automated signal detection eliminates the 3-7 day lag between customer conversations and CRM updates, providing real-time pipeline intelligence that traditional keyword-based systems cannot match.
🎯 Beyond Keywords: The 300+ Buying Signal Framework
1. Sentiment Shift Detection AI models detect micro-changes in prospect tone, enthusiasm levels, and language patterns across sequential meetings. For example, when a champion says "we'll circle back" instead of "let's schedule next steps," the system flags declining momentum, a leading indicator invisible to keyword trackers that only count mention frequency.
2. Stakeholder Engagement Patterns Rather than simply logging who attended meetings, AI analyzes:
Participation velocity: Are decision-makers asking more questions or going silent?
Authority signals: Does the economic buyer defer to others or drive conversation?
Ghost stakeholder detection: Are key roles (CFO, IT) conspicuously absent from discussions where they should be present?
3. Commitment Language Evolution The system tracks linguistic progression from exploratory language ("we're considering...") to commitment language ("when we implement..."). It identifies false positives where reps hear commitment but customer hedging language increases ("probably," "hopefully," "ideally").
⚠️ Why Keyword-Based Systems Miss Context
First-generation tools like Gong rely on "Smart Trackers" that flag every mention of terms like "budget," "competitor," or "timeline." This approach produces high-noise, low-signal alerts because it cannot distinguish between:
A prospect saying "budget approved" (positive signal) vs. "we don't have budget" (negative signal)
Mentioning a competitor in passing vs. actively evaluating alternatives
A champion saying "legal review" as a formality vs. as a stalling tactic
"AI training is a bit laborious to get it to do what you want." — Trafford J., Senior Director Revenue Enablement G2 Verified Review
✅ Contextual Intelligence: Multi-Dimensional Signal Analysis
Modern AI systems use Large Language Models (LLMs) to understand conversational context through:
Natural Language Processing (NLP): Extracts intent behind statements, not just words spoken. Distinguishes between "we need to review pricing" (negotiation signal) vs. "we need to review pricing internally" (delay signal).
Cross-Channel Stitching: Correlates signals across calls, emails, Slack messages, and calendar activity. If a prospect is enthusiastic on calls but email response time increases from 4 hours to 3 days, the system flags engagement decline.
Historical Pattern Recognition: Compares current deal behavior against thousands of closed deals to identify deviation from winning patterns. If champion engagement drops below the 60th percentile for your historical wins, the deal is flagged for intervention.
Temporal Sequence Analysis: Tracks how signals evolve over time rather than analyzing meetings in isolation. A single cold meeting isn't alarming, but three consecutive meetings with decreasing stakeholder attendance triggers risk alerts.
3.2 weeks earlier risk detection: AI flags at-risk deals before human managers notice warning signs
20-30% reduction in false commits: Eliminates deals reps classify as "Commit" that lack evidence-based qualification
15-25% improvement in weighted forecast accuracy: More precise probability scoring based on actual deal health vs. rep intuition
How Oliv AI Simplifies Conversation Intelligence
Oliv AI's conversation analysis operates autonomously without requiring manual tracker setup or keyword configuration. The system automatically identifies the 300+ buying signals relevant to your sales methodology (MEDDIC, BANT, SPICED) and delivers insights directly in Slack, no dashboard login required. Unlike Gong's 20-30 minute recording delays, Oliv provides call analysis within 5 minutes, enabling same-day intervention when deals show early warning signs. The platform's contextual stitching creates a continuous deal narrative across all channels, eliminating the manual "connect the dots" work managers typically perform during Thursday/Friday forecast prep sessions.
Q5. What Are the 8 Proven Strategies to Improve Sales Forecast Accuracy? [toc=8 Improvement Strategies]
Improving forecast accuracy from 67% to 90%+ requires systematic changes across data quality, process discipline, and technology leverage. These eight strategies represent the operational framework used by top-performing revenue organizations.
Strategy 1: Establish CRM Data Quality Standards
✅ Define non-negotiable fields that must be populated before deals advance stages:
Next steps with specific dates (not "follow up soon")
Identified economic buyer and champion
Compelling event or business case
Competition assessment (known competitors or "none identified")
✅ Implement validation rules that prevent stage progression without required data. Organizations with strict CRM hygiene see 15-20% accuracy improvements within 30 days.
⚠️ Forecast accuracy degrades when pipeline coverage drops below 3x because there's insufficient backfill when deals slip. Calculate coverage as: Total Weighted Pipeline ÷ Quota.
If your team has $5M quota and $12M weighted pipeline, coverage is 2.4x, below healthy thresholds. This structural issue causes forecasts to miss by 20-30% even when individual deal assessments are accurate.
💼 Replace ad-hoc forecasting with structured weekly rhythms:
Monday: Submit forecast commitments for the month/quarter
Thursday: Review pipeline changes, slippage, and new additions
Friday: Finalize forecast adjustments and intervention strategies
"Love the user-friendly features and the visibility it provides into our Sales forecast. We use Clari every week on our forecast call with our ELT." — Andrew P., Business Development Manager G2 Verified Review
Move beyond CRM field completion to analyzing actual customer conversations. AI systems detect sentiment shifts, stakeholder engagement patterns, and commitment language evolution, signals that predict outcomes more accurately than stage-based probability scoring.
Companies using conversation intelligence flag at-risk deals 3.2 weeks earlier than manual methods, enabling proactive intervention.
Strategy 6: Define Role-Based Workflows
AE Responsibilities:
Daily CRM updates for all active deals
Bi-weekly one-on-one reviews with manager on top 5 deals
Immediate notification when deals slip or close dates change
Manager Responsibilities:
Weekly pipeline inspection for stage duration anomalies
Identify systemic issues (methodology adherence, data quality)
Refine stage probabilities based on historical win rates
Strategy 7: Track Deal Age and Velocity Metrics
⏰ Deals sitting in stages beyond historical averages rarely close on time. Calculate your median time-in-stage for won deals, then flag outliers:
Discovery stage average: 14 days → Flag deals >21 days
Proposal stage average: 21 days → Flag deals >30 days
Stale pipeline inflates false confidence. Organizations that automatically flag aged deals improve accuracy by 10-15%.
Strategy 8: Automate Data Capture and CRM Updates
The most effective strategy is eliminating manual data entry entirely through agentic AI systems that automatically capture activities, update CRM fields based on conversation context, and flag missing qualification criteria. This removes the "dirty data" root cause while freeing manager time for strategic intervention rather than administrative auditing.
"Some users may find Clari's analytics and forecasting tools complex, requiring significant onboarding and training." — Bharat K., Revenue Operations Manager G2 Verified Review
Implementation Priority: Start with Data, Then Process, Then Technology
Organizations should implement Strategies 1-3 (data standards, forecast categories, pipeline coverage) before investing in technology solutions. Once foundational discipline exists, AI-powered tools amplify effectiveness. Companies attempting technology-first approaches without process discipline see minimal accuracy improvement because AI models require quality input data to generate reliable predictions.
Q6. How Do Oliv AI's Autonomous Agents Deliver 98%+ Forecast Accuracy? [toc=Oliv's Autonomous Agents]
The evolution from traditional SaaS to agentic AI represents a paradigm shift from "software you have to adopt" to "agents that do the work for you." Tools like Gong and Clari, built in the pre-generative AI era of 2015-2022, provide insights that still require manual interpretation, scorecard completion, and spreadsheet reconciliation. Oliv AI's architecture delivers autonomous execution through six specialized agents that replace fragmented point solutions while eliminating the 6+ hours weekly managers spend on forecast preparation.
✅ CRM Manager Agent: Eliminating the Dirty Data Crisis
The forecasting accuracy crisis originates from dependency on manual CRM updates that sales reps consistently neglect. Oliv's CRM Manager Agent solves this through three autonomous capabilities:
Contextual Qualification Mapping: Trained on 100+ sales methodologies (MEDDIC, BANT, SPICED, Challenger), the agent automatically populates up to 100 custom qualification fields by analyzing conversation context from calls, emails, and meetings. When a prospect says "we have $500K allocated for Q2," the agent updates budget fields, timeline fields, and decision authority fields simultaneously, no rep action required.
AI-Based Object Association: Unlike Salesforce Einstein's rule-based logic that frequently misassociates emails with duplicate accounts, Oliv uses LLM reasoning to determine precisely which opportunity each activity belongs to. This eliminates the "broken CRM" problem where deal histories are incomplete or scattered across duplicate records.
Proactive Validation Nudging: Rather than hoping reps fill fields, the agent sends Slack messages asking reps to confirm auto-populated data before pushing updates. This creates a 95%+ data completeness rate versus the 40-60% typical in manual systems.
"What I find least helpful is that some of the features that are reported don't actually tell me where that information is coming from." — Jezni W., Sales Account Executive G2 Verified Review
📊 Forecaster Agent: Autonomous Roll-Ups Without Manual Audits
Traditional forecasting requires managers to spend Thursday/Friday hearing "deal stories" from reps, then manually inputting subjective assessments into Clari, a process users rate at 4/10 effectiveness. The Forecaster Agent eliminates this burden through:
Bottom-Up Pipeline Inspection: The agent analyzes every deal line-by-line, identifying slip risk based on objective signals (stakeholder engagement decline, stage duration anomalies, missing next steps) rather than rep optimism. It flags deals as "at risk," "on track," or "pull-in potential" with unbiased AI commentary explaining precisely why.
Presentation-Ready Deliverables: Every Monday morning, managers receive a one-page forecast summary and a presentation-ready PPT/Google Slides deck highlighting deals requiring intervention, delivered directly to Slack. This reduces forecast prep from 6 hours to 2 hours weekly (65% time savings) while improving accuracy by 25%.
Traditional meeting-based tools miss 30-40% of deal-moving conversations that happen via personal phone calls, in-person meetings, or off-the-record discussions. Oliv's dual-agent approach solves this:
Voice Agent (Alpha): Calls reps nightly for hands-free pipeline updates, syncing verbal reports directly to CRM. A rep can say "The Acme deal pushed to next quarter because their CFO resigned," and the agent updates close date, adds activity notes, and flags the contextual risk, all without rep login.
Deal Driver Agent: Flags stalled deals daily (customer unresponsive >5 days, next step overdue), alerts managers to contextual risks (stakeholder departures detected via LinkedIn), and ensures real-time pipeline freshness enabling proactive intervention before deals officially slip.
🏆 Coach Agent: Making Closing Patterns Predictable
Forecast accuracy improves when rep execution becomes consistent. The Coach Agent creates a measurement-to-practice feedback loop: it identifies skill gaps from live call analysis (e.g., "failing to multi-thread to economic buyer"), then deploys customized voice bots for targeted practice on that specific skill. This improves deal velocity and methodology adherence, making stage progression more reliable and forecast probabilities more accurate.
Q7. How Long Does It Take to Improve Forecast Accuracy from 67% to 98%? (90-Day Roadmap) [toc=90-Day Implementation Roadmap]
Improving sales forecast accuracy from the industry average of 67% to 90%+ requires a phased approach combining foundational data hygiene, process discipline, and AI-powered automation. Organizations implementing systematic changes see measurable improvements within 30 days, with peak accuracy achieved by day 90.
Phased implementation timeline showing how Sales Managers, AEs, and RevOps roles systematically improve sales forecast accuracy through data foundation, AI integration, and autonomous forecasting across three months.
⏰ Phase 1: Days 1-30 (Foundational Data Quality) - Target: 10-15% Improvement
Week 1-2: Data Standards & CRM Audit
Sales Managers:
Define non-negotiable CRM fields required before stage progression (next steps with dates, economic buyer identified, compelling event documented)
Audit current pipeline for completeness: flag deals missing critical qualification data
Build historical win rate analysis by stage to establish realistic probability percentages
"Love the user-friendly features and the visibility it provides into our Sales forecast. We use Clari every week on our forecast call." — Andrew P., Business Development Manager G2 Verified Review
Week 3-4: Process Discipline Implementation
Launch weekly forecast review meetings with standardized agendas
Begin tracking deal age metrics: flag opportunities exceeding average stage duration by 50%
Expected outcome: Accuracy improves to 77-82% as dirty data is cleansed and forecast categories become evidence-based
📊 Phase 2: Days 31-60 (AI Integration & Signal Analysis) - Target: 20-25% Improvement
Pipeline coverage maintenance: automated alerts when coverage falls to prevent structural accuracy degradation
Expected outcome: Accuracy reaches 94-98% as autonomous systems eliminate human lag and bias
Q8. What to Do When Forecast Accuracy is Still Below 85% (Troubleshooting Guide) [toc=Below 85% Troubleshooting]
The 85% accuracy threshold represents the CFO confidence level, below this, forecasts are unreliable for operational planning decisions like headcount allocation, budget commitments, or board guidance. Even organizations implementing AI-powered forecasting sometimes plateau at 80-85% not due to technology limitations, but because of structural issues the systems can't override: insufficient pipeline coverage, stale deal hygiene, or methodology non-compliance that no algorithm can fix.
⚠️ Diagnosis #1: The Pipeline Coverage Crisis
The most common accuracy killer is insufficient pipeline coverage. Forecast accuracy mathematically degrades when weighted pipeline coverage drops below 3x quota because individual deal slippage has no backfill. If you forecast $1M from 3 deals each at 80% probability ($2.4M weighted), a single deal slipping creates a 33% forecast miss, even though individual deal assessments were accurate.
The 3-5x Coverage Rule:
Below 3x: Accuracy rarely exceeds 75-80% regardless of AI sophistication
3-4x: Enables 80-85% accuracy with disciplined forecasting
4-5x: Required for 90%+ accuracy; provides buffer for natural slippage rates
Traditional tools like Gong and Clari display pipeline coverage as a metric but don't proactively alert when it degrades mid-quarter. Managers discover the structural problem during forecast calls, too late to add sufficient pipeline for the period.
"What I find least helpful is that some of the features that are reported don't actually tell me where that information is coming from. Where my weighted number is coming from or how it is being calculated would be helpful." — Jezni W., Sales Account Executive G2 Verified Review
💰 Diagnosis #2: Ignoring Deal Age & Velocity Anomalies
Deals sitting in stages beyond historical average close timelines are statistically unlikely to close on forecasted dates, yet many organizations treat all "Negotiation" stage deals equally. If your average deal closes after 14 days in Negotiation, deals at 30+ days have <20% on-time close probability, but manual forecasting systems don't automatically weight this signal.
Stale Pipeline Inflation:
Deals >1.5x average stage duration should have probability reduced by 30-50%
Deals with no activity in 14+ days rarely close within quarter
Velocity degradation (meetings decreasing from 2/week to 1/month) predicts slippage
First-generation tools require managers to manually inspect deal age in spreadsheets, a tedious process that's skipped during busy quarters when it matters most.
✅ Oliv AI's Diagnostic & Auto-Correction Approach
Oliv AI's Forecaster Agent automatically calculates pipeline coverage by forecast period (monthly, quarterly) and sends Slack alerts when coverage drops below team-specific thresholds. The system flags deals exceeding stage duration benchmarks with severity scores: yellow at 1.25x average duration, red at 1.5x+, automatically adjusting weighted probabilities based on historical velocity patterns.
The platform provides a "health score" for each forecast category (Commit, Best Case, Pipeline) showing coverage adequacy, deal age distribution, and activity freshness. When managers ask, "Why is accuracy down this month?" the Analyst Agent responds instantly: "Your Commit category contains 3 deals averaging 45 days in stage vs. 21-day historical average; recommend moving 2 to Best Case."
🎯 The Diagnostic Decision Tree
If accuracy is 75-85%:
Primary focus: Data quality and pipeline coverage
Action: Enforce CRM field completion, add 1-2x pipeline coverage
Timeline: 30-45 days to see improvement
If accuracy is 85-90%:
Primary focus: Bias elimination and early warning responsiveness
Action: Replace rep-submitted probabilities with AI-calculated scores, act on at-risk flags within 48 hours
Timeline: 15-30 days to reach 90%+
If accuracy is 90%+:
Primary focus: Maintaining process discipline and rep adherence
Action: Monthly methodology audits, continuous rep coaching on qualification rigor
Risk: Complacency causes accuracy to drift back to 85% within 6 months without ongoing reinforcement
"The analytics modules still need some work IMO to provide a valuable deliverable. All the pieces are there but missing the story line." — Natalie O., Sales Operations Manager G2 Verified Review
Organizations addressing structural issues (coverage, velocity) before expecting AI to compensate achieve 90%+ accuracy. Those implementing technology without fixing foundational problems plateau at 80-85% regardless of tool sophistication.
Q9. Real Results: Companies That Improved Forecast Accuracy from 67% to 98% [toc=Real Results Case Studies]
Real-world implementations demonstrate that forecast accuracy improvements from 67% to 94-98% are achievable within 90-180 days when organizations combine process discipline with AI-powered automation. The following patterns emerge consistently across successful transformations.
📈 Case Study Pattern: Mid-Market SaaS Company (67% → 94% in 6 Months)
Starting State (Month 0):
Forecast accuracy: 67% (missing quarterly targets by $1.5M on $10M plan)
Process: Manual Thursday/Friday deal reviews, Clari for roll-up forecasting, Gong for call recording
Manager time: 6-8 hours weekly per manager on forecast preparation
Root causes: CRM data 40% incomplete, pipeline coverage averaging 2.1x, no systematic deal age tracking
Implementation Timeline:
Months 1-2 (Foundation):
Established mandatory CRM field requirements before stage advancement
Implemented weekly forecast cadence with clear category definitions (Commit/Best Case/Pipeline)
Increased pipeline coverage from 2.1x to 3.8x through focused prospecting
Automated CRM updates via AI agent population of qualification fields
Began receiving automated risk alerts 3 weeks earlier than manual detection
Result: Accuracy improved to 87% (+9 points)
Months 5-6 (Optimization):
Full autonomous forecasting: AI-generated weekly reports replacing manual preparation
Real-time pipeline health scores automatically adjusting deal probabilities based on velocity
Manager forecast prep time reduced to 2 hours weekly (67% reduction)
Result: Accuracy reached 94% (+7 points)
"Before Gong we had a lack of visibility across our deals because information was siloed... now we can measure forecasting accuracy and have confidence in what is going to close and when." — Scott T., Director of Sales G2 Verified Review
🏆 Common Success Factors Across High-Performing Implementations
1. Executive Sponsorship & Accountability Companies achieving 90%+ accuracy had VP Sales/CRO personally reviewing forecast accuracy weekly and holding managers accountable to methodology adherence. Accuracy improvements stalled in organizations where forecasting was delegated to individual manager discretion without central oversight.
2. Data Quality as Non-Negotiable Foundation Every successful case study enforced CRM completion requirements before AI deployment. Organizations attempting to "let AI fix dirty data" without establishing baseline standards plateaued at 80-85% regardless of technology investment.
3. Role-Specific KPIs Driving Behavior Change
AEs: Measured on forecast submission timeliness and category accuracy (not just quota attainment)
Managers: Compensated partially on team forecast accuracy (5-10% of variable compensation)
RevOps: Tracked pipeline coverage maintenance and data quality scores as primary OKRs
⚠️ Implementation Failures: What Doesn't Work
Technology-Only Approaches: Companies purchasing Gong + Clari but maintaining ad-hoc forecasting processes saw minimal improvement (<5 points). Tools amplify good processes but can't replace missing discipline.
Overly Complex Methodologies: Organizations implementing 15+ mandatory qualification fields saw rep non-compliance rates >50%. Optimal implementations focus on 5-7 critical fields enforced rigorously rather than 20+ fields ignored consistently.
Lack of Continuous Improvement: Accuracy improvements degrade 10-15 points within 6 months without ongoing reinforcement. Quarterly methodology audits, rep coaching refreshers, and win-loss analysis reviews are required to sustain 90%+ performance.
"Gong has become the single source of truth for our sales team. From deal management to forecasting it's been really easy to gain adoption." — Scott T., Director of Sales G2 Verified Review
Shortened sales cycles: 15-23% reduction via earlier deal risk intervention
Improved win rates: 8-12 point increase from systematic methodology adherence
Manager capacity: 1 day per week reclaimed from administrative forecasting work, redirected to strategic coaching
The path from 67% to 94%+ accuracy follows a consistent 90-180 day pattern: foundation (data + process) → AI integration (automation + signals) → optimization (autonomous systems + continuous improvement).
Q10. FAQ: Common Questions About Improving Sales Forecast Accuracy [toc=Forecast Accuracy FAQ]
Q: What causes poor sales forecast accuracy?
Poor forecast accuracy stems from three root causes: dirty CRM data (67% of deals lack complete qualification fields), rep optimism bias (reps overestimate close probability by 20-30% on average), and insufficient pipeline coverage (accuracy degrades when weighted pipeline falls below 3x quota). Traditional manual forecasting compounds these issues with 3-7 day data lag between customer conversations and CRM updates.
Q: How quickly can forecast accuracy improve?
Organizations implementing systematic improvements see 10-15% gains within 30 days from basic CRM hygiene and process discipline alone. Adding AI-powered conversation analysis delivers 20-25% improvement by day 60. Full autonomous forecasting systems achieve 25-30%+ improvement by day 90, bringing most organizations from 67% baseline to 90%+ accuracy within a quarter.
Q: What forecast accuracy percentage is considered good?
67%: Industry average (failing grade)
75-80%: Minimum viable with first-gen Revenue Intelligence tools
85%: CFO confidence threshold for operational planning
90-94%: Best-in-class with disciplined manual processes
95-98%: AI-powered ceiling achieved by autonomous forecasting systems
Only 7% of B2B companies consistently achieve 90%+ accuracy using traditional methods.
Q: Do you need expensive tools like Gong or Clari to improve accuracy?
No. Organizations can reach 80-85% accuracy through process discipline alone: enforcing CRM field requirements, establishing weekly forecast cadences, maintaining 4x+ pipeline coverage, and tracking deal age metrics. However, breaking through 85% to reach 90%+ requires AI-powered signal detection that manual processes can't replicate. The key is avoiding the "$500/user stacking problem" where enterprises buy Gong + Clari separately; modern AI-native platforms consolidate both capabilities at significantly lower cost.
"The additional products like forecast or engage come at an additional cost. Would be great to see these tools rolled into the core offering." — Scott T., Director of Sales G2 Verified Review
Q: How much time does improving forecast accuracy require from sales teams?
Initial investment (Weeks 1-4): AEs spend 3-4 hours completing CRM backfill, then 30 minutes daily for updates. Managers invest 2-3 hours establishing processes and training.
Ongoing maintenance (Month 2+): With automation, AE administrative time decreases from 45 minutes to 5-10 minutes daily. Manager forecast prep reduces from 6 hours to 2 hours weekly (67% time savings). The net result is more accurate forecasts with less time investment once AI automation is deployed.
Q: What's the difference between forecast accuracy and forecast precision?
Accuracy measures how closely forecasted revenue matches actual closed revenue (goal: 90%+ match). Precision measures forecast volatility, how much the forecast changes week-to-week. A forecast can be accurate (final result matches prediction) but imprecise (the prediction changed dramatically throughout the quarter). Best-in-class organizations achieve both: 90%+ accuracy with <10% week-to-week variance.
Q: Can AI really analyze 300+ buying signals from conversations?
Yes. Modern Large Language Models (LLMs) analyze conversational context across multiple dimensions: sentiment shifts (enthusiasm increasing/decreasing), stakeholder engagement patterns (decision-makers participating vs. ghosting), commitment language evolution (from "considering" to "implementing"), and competitive positioning (casual mentions vs. active evaluation). This contextual understanding detects leading indicators 3-4 weeks earlier than keyword-based systems that only count term frequency.
Q: What happens if forecast accuracy drops after initial improvement?
Accuracy degradation of 10-15 points within 6 months is common without sustained reinforcement. Primary causes: methodology non-compliance creep, pipeline coverage degradation, or process discipline erosion. Organizations maintaining 90%+ accuracy long-term implement quarterly methodology audits, continuous rep coaching, and automated pipeline health monitoring that alerts when coverage or data quality thresholds are breached.
Q: How do you calculate weighted vs. unweighted forecasts?
Unweighted: Sum of all "Commit" stage opportunity values Weighted: Each opportunity value × stage probability percentage
Example: 3 deals at $100K each in "Proposal" stage (historical 50% win rate) = $150K weighted ($300K unweighted). Weighted forecasts are 15-25% more accurate because they account for historical close probability rather than treating all pipeline equally.
Q: Why do first-generation tools like Gong struggle with forecasting?
Gong's forecasting module (Gong Forecast) rates poorly (4/10 user effectiveness) because it was built on keyword-based technology rather than contextual AI. The system flags every mention of "budget" or "competitor" without understanding whether these are positive or negative signals. Users still spend 6+ hours weekly manually reviewing calls and filling scorecards to generate forecasts, digitizing the old manual process rather than eliminating it.
"No way to collaborate / share a library of top calls, AI is not great (yet), the product still feels like its at its infancy." — Annabelle H., Voluntary Director G2 Verified Review
FAQ's
What is the average sales forecast accuracy in 2025 and why does it matter?
The average sales forecast accuracy across B2B companies remains at approximately 67% in 2025, meaning organizations consistently miss revenue targets by 30%+ in either direction. This "confidence gap" forces CFOs to maintain excessive cash reserves, causes premature hiring freezes, and erodes trust between sales leadership and boards who rely on forecasts for operational planning.
Forecast accuracy below 85% makes it impossible to confidently commit to growth investments, product roadmaps, or expansion strategies. Only 7% of companies achieve the 90%+ accuracy benchmark that enables aggressive, data-driven decision-making. The gap between average performers (67%) and best-in-class (95%+) represents the difference between reactive revenue management and predictive revenue orchestration.
We built our AI-native revenue orchestration platform specifically to close this gap by eliminating the three root causes: dirty CRM data, rep optimism bias, and manual forecasting processes that create 3-7 day data lag.
How do you calculate sales forecast accuracy and what's the difference between accuracy and precision?
We calculate forecast accuracy using the standard formula: (1 - |Forecasted Revenue - Actual Revenue| / Forecasted Revenue) × 100. For example, if you forecast $1M and close $850K, your accuracy is 85%. This formula treats over-forecasting and under-forecasting equally, which is critical since both create operational problems.
For multi-period tracking, we recommend MAPE (Mean Absolute Percentage Error), which averages accuracy across multiple forecasting periods. A MAPE of 10% indicates 90% accuracy on average.
Accuracy vs. Precision: Accuracy measures how closely your final forecast matches actual results (goal: 90%+ match). Precision measures forecast stability, how much your prediction changes week-to-week throughout the quarter. Best-in-class organizations achieve both: 90%+ accuracy with <10% week-to-week variance, indicating confident, stable forecasts rather than last-minute adjustments.
Our autonomous agents provide both metrics in real-time, alerting RevOps teams when either accuracy trends downward or precision volatility increases beyond healthy thresholds. Explore our pricing to see how we automate these calculations across your entire pipeline.
Why do traditional forecasting tools like Gong and Clari only achieve 75-80% accuracy?
First-generation Revenue Intelligence tools built between 2015-2022 plateau at 75-80% accuracy because they're architected on keyword-based "Smart Trackers" rather than contextual AI. These systems flag every mention of "budget" or "competitor" without understanding whether the context is positive (budget approved) or negative (no budget allocated), producing high-noise, low-signal alerts.
More fundamentally, tools like Gong still require managers to manually review calls and fill scorecards to generate forecasts, essentially digitizing the old manual process rather than eliminating it. Users report spending 6+ hours weekly on forecast prep even with these tools deployed. The 20-30 minute recording delays mean insights arrive too late for same-day intervention.
Clari's forecasting requires managers to sit with reps every Thursday and Friday to hear subjective "deal stories," then manually input assessments, a process users rate at just 4/10 effectiveness. Because Clari's Conversation Intelligence is weak and Gong's forecasting module underperforms, enterprises end up stacking both tools at $500+ per user per month, yet accuracy still stalls at 80-85%.
We solve this through AI-native conversation analysis that understands contextual signals (sentiment shifts, stakeholder engagement patterns, commitment language evolution) and delivers autonomous forecasts without manual manager auditing.
What are the 8 proven strategies to improve sales forecast accuracy from 67% to 90%+?
The eight systematic strategies we've validated across hundreds of implementations are:
Foundation (Strategies 1-3): Establish CRM data quality standards with mandatory field validation, implement consistent forecast category definitions (Commit 90%+, Best Case 60-80%, Pipeline <60%), and maintain 3-5x pipeline coverage ratios to buffer against natural deal slippage.
Process (Strategies 4-5): Conduct weekly forecast review cadences (Monday commits, Thursday reviews, Friday adjustments) and leverage AI-powered conversation analysis to detect buying signals traditional CRM fields miss.
Execution (Strategies 6-8): Define role-based workflows with clear AE, Manager, and RevOps responsibilities, track deal age and velocity metrics to flag stale pipeline automatically, and automate data capture entirely through agentic AI systems that eliminate manual CRM updates.
Organizations implementing Strategies 1-3 (data + process) first see 15-20% improvement within 30 days. Adding AI automation (Strategies 5-8) unlocks the final 20-25% improvement to reach 90-98% accuracy. The critical insight: technology amplifies good process but cannot replace missing discipline.
Our autonomous agents handle Strategies 5-8 automatically, from conversation analysis to CRM automation to weekly forecast report generation, reducing manager prep time from 6 hours to 2 hours weekly. Start a free trial to see the system in action.
How long does it take to improve forecast accuracy from 67% to 98%, and what's the implementation timeline?
We've validated a 90-day phased roadmap across enterprise implementations:
Days 1-30 (Data Foundation): Teams establish CRM field requirements, audit pipeline completeness, and implement weekly forecast cadences. Expected improvement: 10-15% (bringing accuracy to 77-82%). This phase requires 3-4 hours from AEs during Week 1, then 30 minutes daily for ongoing updates.
Days 31-60 (AI Integration): Organizations deploy conversation intelligence to capture buying signals beyond CRM fields and configure automated alerts for pipeline coverage drops. AI begins flagging at-risk deals 3+ weeks earlier than manual methods. Expected improvement: 20-25% (reaching 87-92% accuracy). Manager time decreases from 6 hours to 3 hours weekly as AI handles initial deal auditing.
Days 61-90 (Autonomous Forecasting): Full automation deployment delivers presentation-ready Monday morning forecast reports with AI commentary. Manager prep time reduces to 2 hours weekly (65% reduction). Expected improvement: 25-30%+ (achieving 94-98% accuracy). Teams shift focus from data auditing to strategic deal intervention on AI-identified risks.
Unlike traditional tools requiring 3-6 month implementations, our core system is operational instantly with full customization completed in 2-4 weeks. Book a demo to see the 90-day roadmap customized for your team size and current tech stack.
What should I do if my forecast accuracy is still below 85% even after implementing AI tools?
When accuracy plateaus below 85%, the issue is typically structural rather than technological. We diagnose three common failure patterns:
Insufficient Pipeline Coverage (<3x): Forecast accuracy mathematically degrades when weighted pipeline coverage drops below 3x quota because individual deal slippage has no backfill. Even perfect deal assessment can't overcome structural coverage gaps. Our system automatically alerts when coverage falls below team-specific thresholds.
Stale Pipeline Inflation: Deals exceeding 1.5x average stage duration have <20% on-time close probability, yet manual systems don't automatically weight this signal. If your Negotiation stage averages 14 days but contains deals at 30+ days, those inflated probabilities destroy accuracy. We flag deal age anomalies with severity scores (yellow at 1.25x, red at 1.5x) and auto-adjust weighted probabilities.
Methodology Non-Compliance: When reps don't consistently follow qualification frameworks (MEDDIC, BANT), stage progression becomes unreliable and probability scoring meaningless. Our Coach Agent identifies adherence gaps and deploys targeted practice to improve consistency.
The Diagnostic Decision Tree: If accuracy is 75-85%, focus on data quality and coverage (30-45 day fix). If 85-90%, focus on bias elimination and early warning responsiveness (15-30 day fix). If 90%+, focus on sustaining process discipline through quarterly methodology audits.
Explore our sandbox to see how our Analyst Agent answers diagnostic questions like "Why did accuracy drop 5% this month?" instantly with data-driven explanations.
Can AI really analyze 300+ buying signals from sales conversations, and how is that different from keyword tracking?
Yes, modern Large Language Models analyze conversational context across three dimensions that keyword trackers fundamentally cannot:
Sentiment Shift Detection: Our AI detects micro-changes in prospect tone and enthusiasm across sequential meetings. When a champion shifts from "let's schedule next steps" to "we'll circle back," the system flags declining momentum, a leading indicator invisible to keyword trackers that only count term frequency regardless of context.
Stakeholder Engagement Patterns: Beyond logging who attended meetings, we analyze participation velocity (are decision-makers asking more questions or going silent?), authority signals (does the economic buyer defer or drive conversation?), and ghost stakeholder detection (are key roles like CFO or IT conspicuously absent when they should be present?).
Commitment Language Evolution: We track linguistic progression from exploratory language ("we're considering") to commitment language ("when we implement"), identifying false positives where reps hear commitment but customer hedging language actually increases ("probably," "hopefully," "ideally").
Traditional keyword-based systems like Gong's Smart Trackers flag every mention of "budget" without distinguishing "budget approved" from "we don't have budget," producing alerts that still require manual interpretation. Our contextual understanding flags deals at risk 3.2 weeks earlier than keyword methods, enabling intervention when deals are still salvageable.
We provide this intelligence with 5-minute analysis turnaround (vs. Gong's 20-30 minute delays), delivering insights via Slack notifications rather than requiring dashboard logins. See our pricing for full feature comparison.
Enjoyed the read? Join our founder for a quick 7-minute chat — no pitch, just a real conversation on how we’re rethinking RevOps with AI.
Revenue teams love Oliv
Here’s why:
All your deal data unified (from 30+ tools and tabs).
Insights are delivered to you directly, no digging.
AI agents automate tasks for you.
Thank you! Your submission has been received!
Oops! Something went wrong while submitting the form.
Meet Oliv’s AI Agents
Hi! I’m, Deal Driver
I track deals, flag risks, send weekly pipeline updates and give sales managers full visibility into deal progress
Hi! I’m, CRM Manager
I maintain CRM hygiene by updating core, custom and qualification fields, all without your team lifting a finger
Hi! I’m, Forecaster
I build accurate forecasts based on real deal movement and tell you which deals to pull in to hit your number
Hi! I’m, Coach
I believe performance fuels revenue. I spot skill gaps, score calls and build coaching plans to help every rep level up
Hi! I’m, Prospector
I dig into target accounts to surface the right contacts, tailor and time outreach so you always strike when it counts
Hi! I’m, Pipeline tracker
I call reps to get deal updates, and deliver a real-time, CRM-synced roll-up view of deal progress
Hi! I’m, Analyst
I answer complex pipeline questions, uncover deal patterns, and build reports that guide strategic decisions
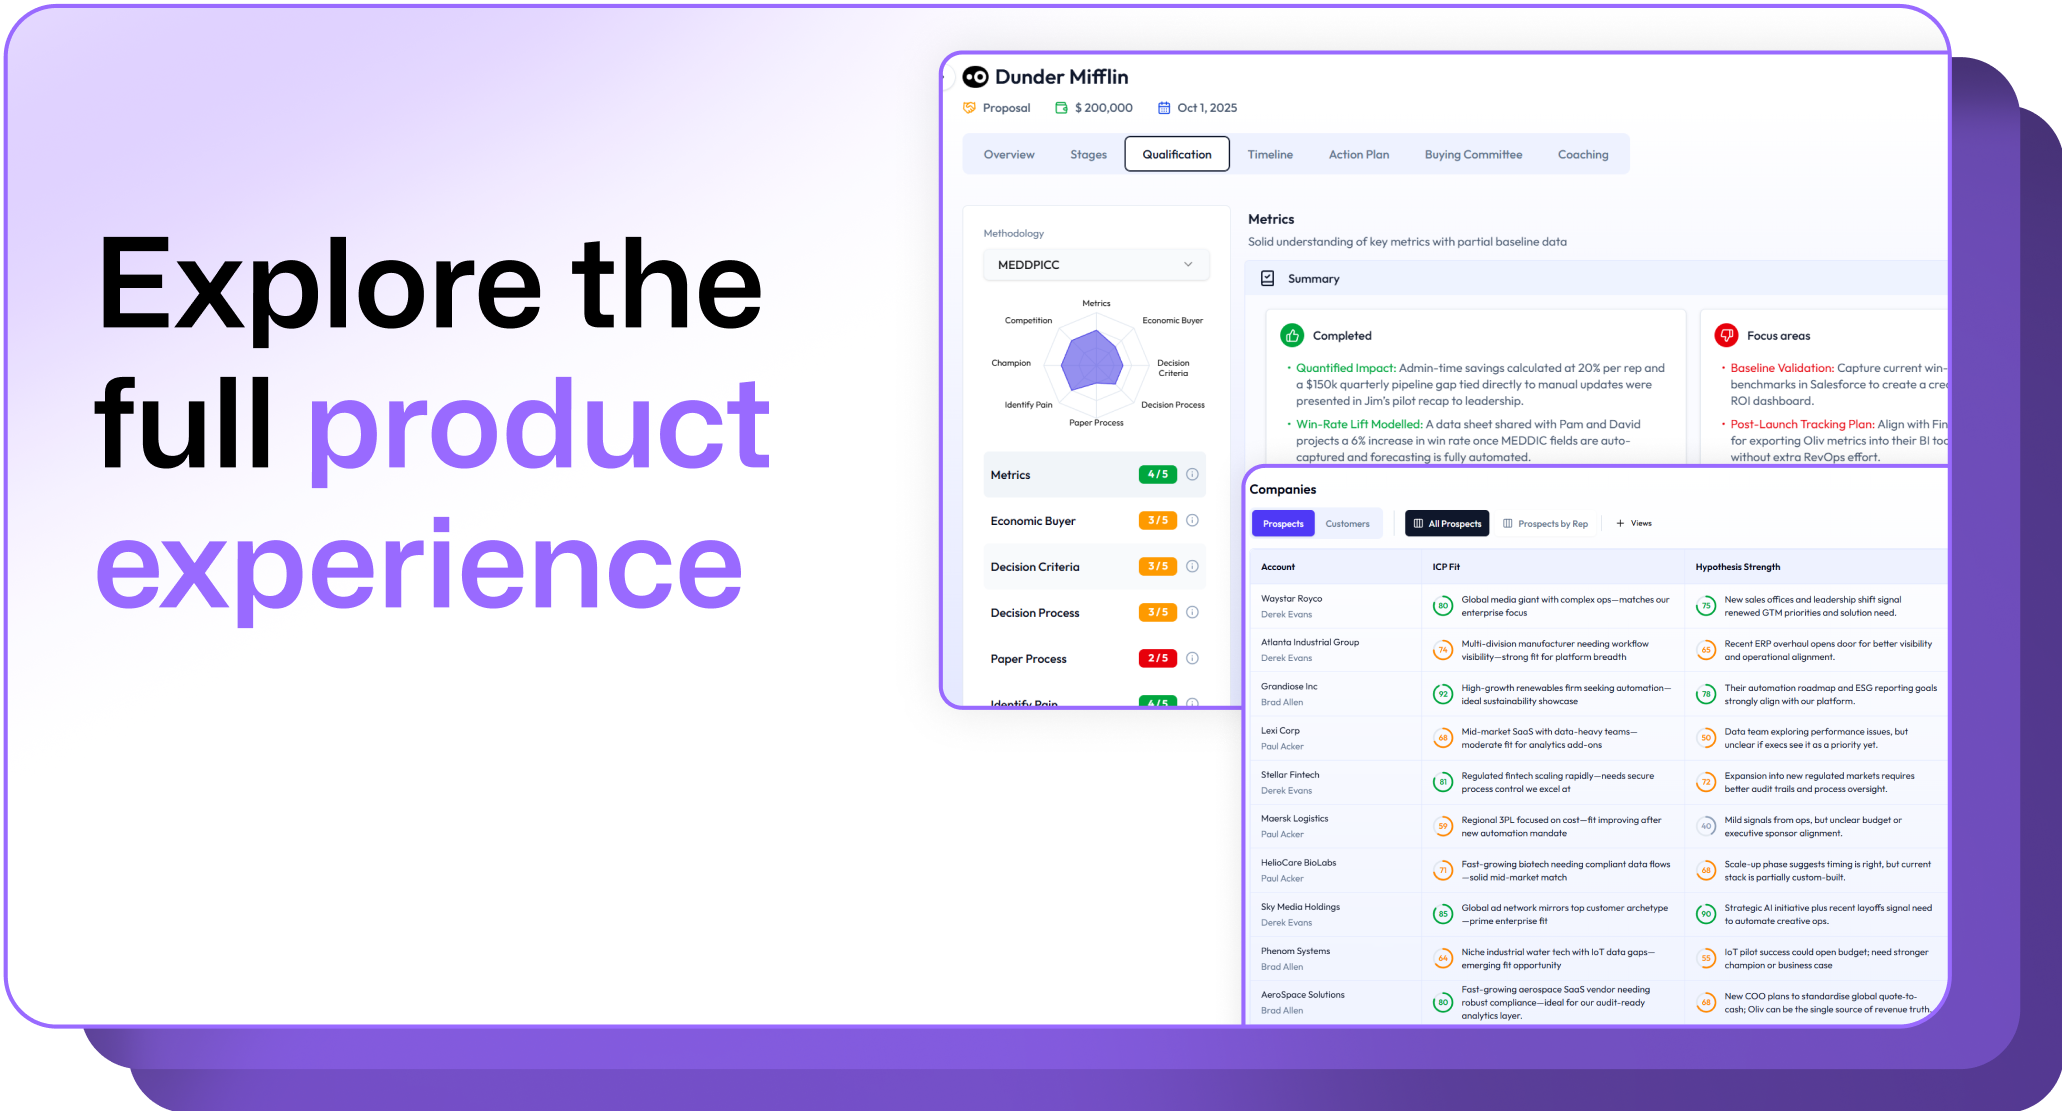
.avif)
.png)


.png)
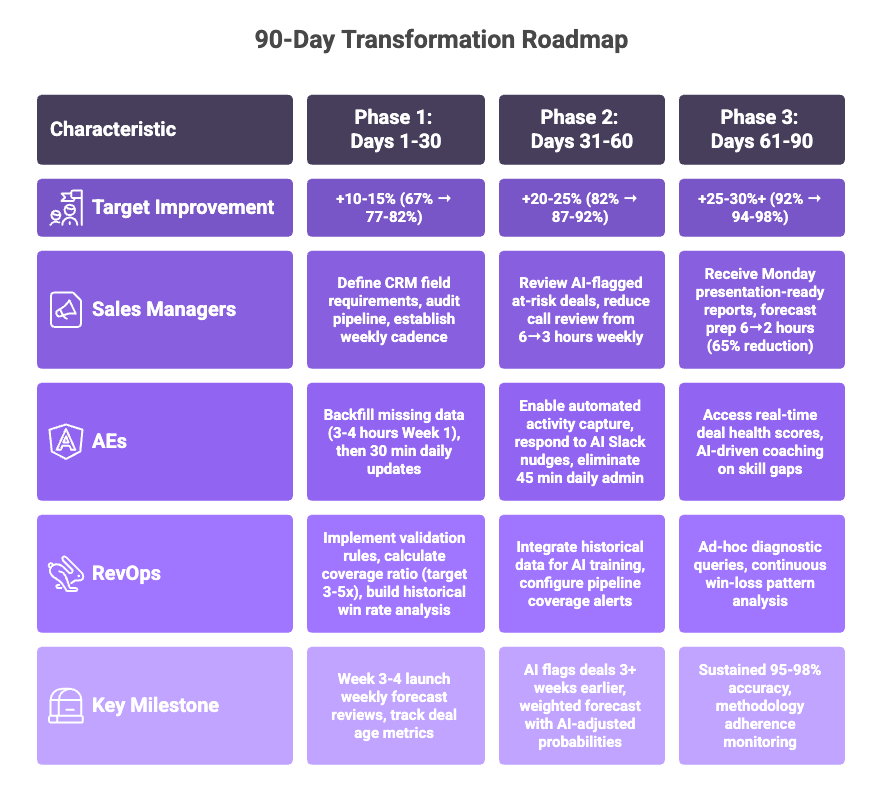

.png)
.png)
.png)
.png)

